LNG – April 19 Bulletin

Asian Prices vs European Benchmark

Prices on the Asian market have decreased below the European benchmark for the first time since the US started exporting LNG in 2016.  

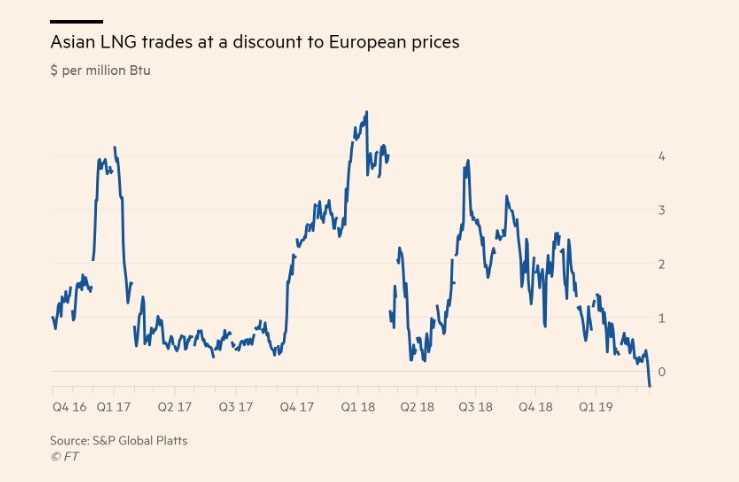
We can easily observe a drastic fell for the LNG prices since the autumn 2018, and especially on the next friday, according the Financial Times, prices collapse due to the current higher seasonal temperatures as well as the recent restarting of Japan nuclear industries and the storage in North Asia still full.

Also, important buyers mainly located in Japan, Taiwan and India, have decreased their demand of cargo deliveries leading the Asian JKM price to $4.429 per million British thermal units, the lowest since April/May 2016 with $5,86 per million Btu. In that sense, China, an other large LNG buyer, is currently more interested for purchasing LNG forward contracts rather than on the spot market for immediate delivery. Prices have also been affected by rising LNG supply, which grew by 12 per cent in February from a year ago, according to consultants Energy Aspects.

As Asian LNG prices have been at their weakest in three years so far this winter, U.S. cargoes have found home in Europe, which has been the top buyer of U.S. LNG this winter season. Indeed, the market has been inundated with supplies coming onstream from the United States, Russia and Australia.

However, a cyclone heading for north western Australia may disrupt LNG loading there,clearing the loading port at Dampier and Ashburton, according to Pilbara Port Authority.

To compare, see below the European LNG benchmark price.

E

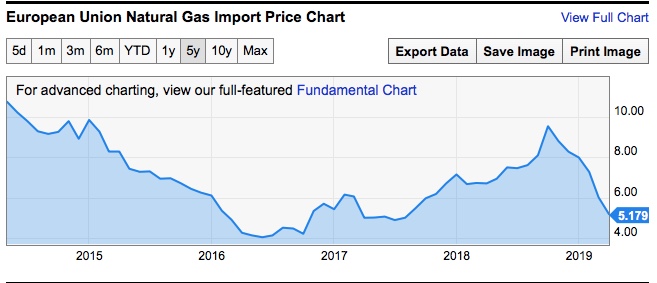
Europe LNG Market is Becoming an increasingly important market.

For some LNG analysts and industry officials, Europe is becoming an important LNG demand market after 2021 especially due to the decline of the natural gas production in northwest Europe, meanwhile that the global LNG supply will growth.

Indeed, the Netherlands is reducing their production at the huge Groningen field, aiming to terminate production by 2030. The UK and Norway may also see drops in natural gas exports.

Forward Curve only for European Countries ( Dutch market )

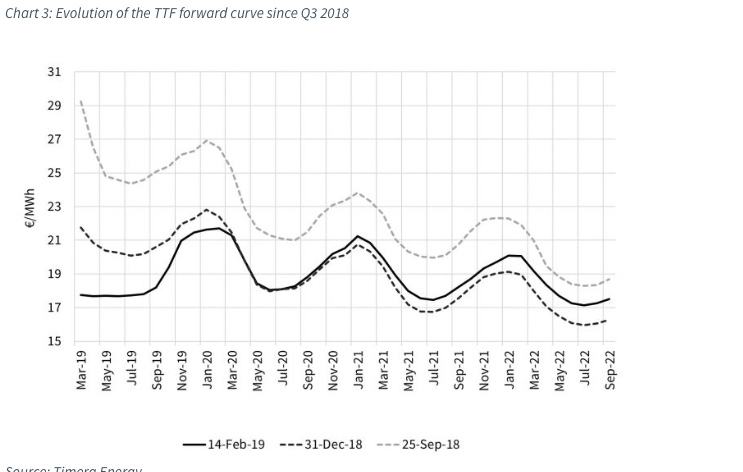
Since December 2018, the futures price falls on the TTF curve ( Title Transfer Facility, is a virtual trading point for natural gas in the Netherlands).

Excepting for a warmer spring than normal, Europeans tend to store gas inventory and so conducting a global decrease of futures prices.

Therefore, we remark a low sharp movement in the front months of the TTF curve.

We can mention that the gas forward curve represents a price indicator for energy prices evolution and futures expectations.

Indeed, the relationship between gas and coal plants in European power markets will be the key price barometer on the European demand side.

Investment of different stakeholders

Chinese state shipbuilding company and Norway-based DNV GL classification society have unveiled a project to develop the world’s largest liquefied natural gas (LNG) carrier with a capacity of 270,000 cubic meters. which will be run on LNG thanks to the royal Dutch  shell and tokyo Gas agreement.

Chevron second biggest oil company are investing in unconventional resources in the permian basin, the goal is to use produce 600’000 barrels a day in the end of 2020, and reach 900’000 barrels by the end of 2023 some of that will go to the LNG plant and around the world to serve the growing demande

Source for forward curve :

Other sources :

https://oilprice.com/Energy/Natural-Gas/Europe-To-Become-Increasingly-Important-LNG-Demand-Market.html

https://uk.reuters.com/article/us-global-lng/asian-european-lng-prices-crash-below-5-on-oversupply-idUKKCN1R21LO

https://www.ft.com/content/9c485852-4cb6-11e9-bbc9-6917dce3dc6
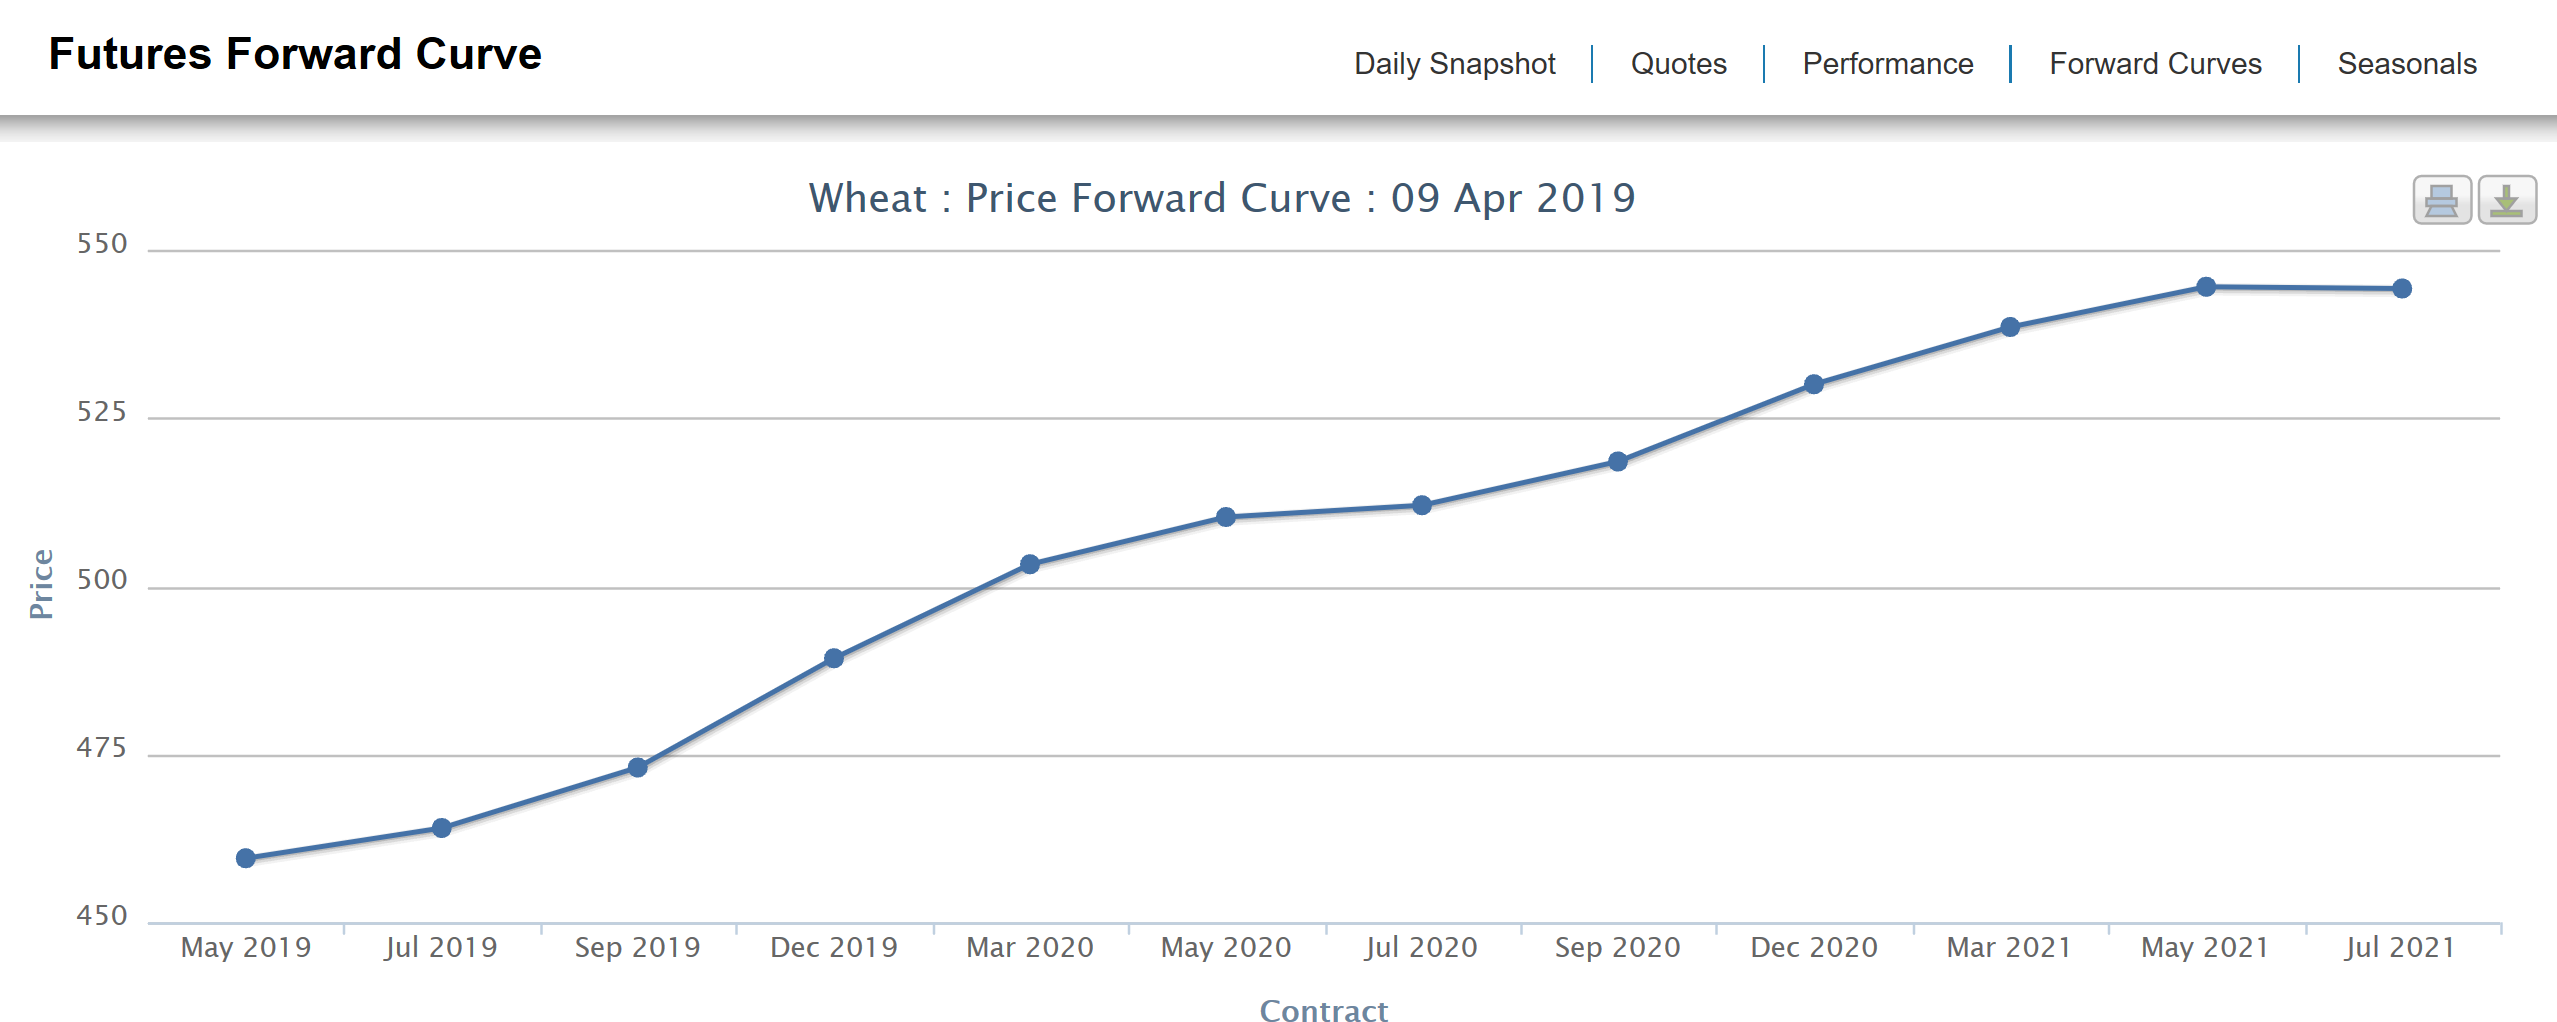
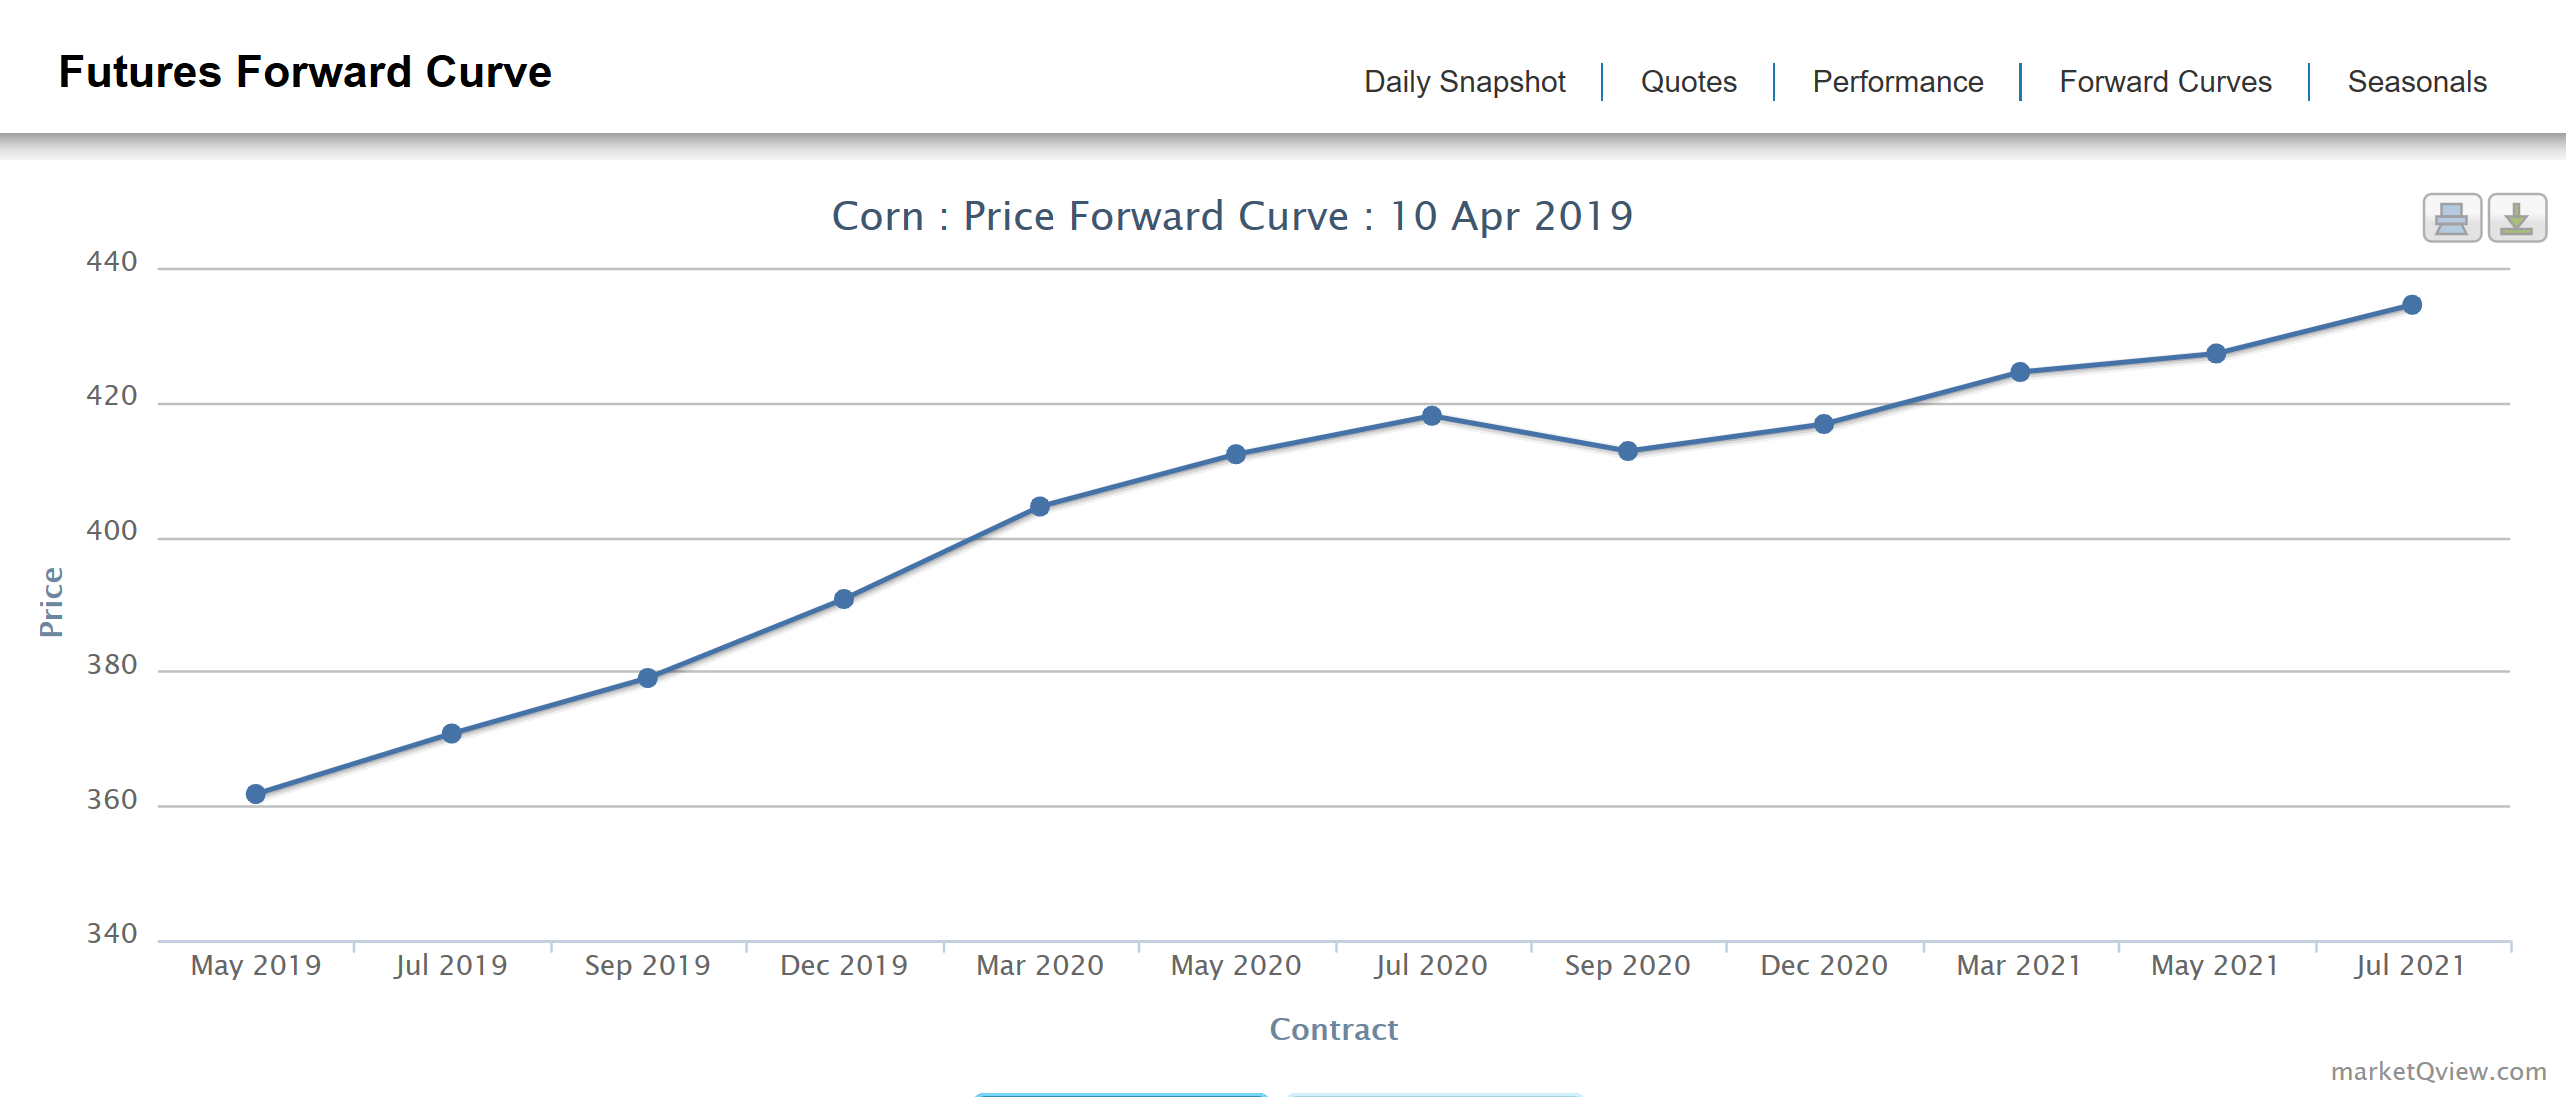

US Wheat and Corn market is currently into trouble

Wheat Prices

Chicago wheat futures decrease for a fifth consecutive day on Wednesday 10 April, the worst losing streak since February, after a U.S. government report raised its estimate for world wheat inventories.
The most-active wheat contract on the CME was down 0.3 percent at $4.58 a bushel. The five days of losses for the wheat contract are the worst streak of declines since prices dropped for six days in a row from Feb. 25 to March 4.
The wheat market is under pressure after the U.S. Department of Agriculture (USDA) in a monthly report on Tuesday raised its forecast of global 2018/19 wheat ending stocks to 275.61 million tonnes, the highest in a range of trade expectations. The USDA also boosted its estimate of domestic wheat supplies.

Corn Prices

South American bids were down, reflecting abundant exportable supplies. Argentine bids fell $3/ton to $159, while Brazilian bids, reflecting improved prospects for second-crop corn, were down $25/ton to $165. Black Sea bids rose $2/ton to $174 on stronger demand from the European Union. U.S. bids fell only $3/ton to $170 as larger- than-expected planting intentions were mostly offset by concerns over planting delays and weather-related river logistics complications.

Prospective Plantings in the US:
Corn planted area for all purposes in 2019 is estimated at 92.8 million acres, up 4 percent or 3.66 million acres from last year.
All wheat planted area for 2019 is estimated at 45.8 million acres, down 4 percent from 2018. This represents the lowest all wheat planted area on record since records began in 1919. Winter wheat (HRW, SRW, and White Winter) is down 3 percent from last year.
Area planted to other spring wheat for 2019 is estimated at 12.8 million acres, down 3 percent from 2018. Of this total, about 12.4 million acres are Hard Red Spring wheat. Durum planted area for 2019 is estimated at 1.42 million acres, down 31 percent from the previous year.

Problem in the US due to the USDA report and Weather
USDA (U.S department of agriculture) report of the month of April has highly impacted the future price of corn and wheat. Indeed, an increase is forecasted in U.S corn ending stocks. Indeed, the USDA reported that the amount left over of corn for the end of the 2018/19 marketing year was 1.835 billion which is historically high. More supply means that the price of corn will go down.

Moreover, Corn is also threatened by terrible weather condition into the southern fringes of the crop belt. Even more alarming, the US farmer have started to plant the 2019 corn and wheat crops. The current snowstorm will have some impact as it might kill the crop that are really fragile currently. 15 to 30 cm of snow are forecasted in the area of South Dakota, Nebraska, Iowa, Minnesota and Wisconsin. This is also combined by the recent flooding disaster that happened recently in the US.

Figure 1: Corn Belt

Figure 2: Wheat Belt

Trading houses reaction to the hard times of soft commodities
From the trader point of view, it appears that soft commodities are not as profitable as it used to be. It is mostly due to the US – China Trade war and the weakened the amount of shipment between the 2 countries. The profit of ADM has been reduced from the food industry. For ADM the food segment an operating profit of $339 million in 2018, compared to $546 million for 2017, (includes grain handling). The solution found by ADM is to force early retirement among many employees of the enterprises such as traders and operators to improve the productivity.

Future prices

Figure 3: $/bushel

Figure 4: $/bushel

Bibliography:
https://af.reuters.com/article/commoditiesNews/idAFL8N21Q5EC

https://www.reuters.com/article/us-archer-daniels-workers/u-s-grain-trader-adm-says-to-seek-early-retirements-may-cut-jobs-idUSKCN1RM2MF
http://marketqview.com/forwardcurvechart.php?ID=19&TYPE=Price

Copper Bulletin N°2

Better perspectives in copper supply

World’s major miners believe that copper market will be considerably better supplied in the mid-term than a year ago.

This positive view is due to a strong demand trend and the fact that copper companies think that new mines are needed. Those able to develop these new projects will increase volumes, profit and revenues. Therefore, the high copper prices in 2017-2018 have also encouraged few companies to invest in new copper projects. This new production will lead to an expected 900’000 tons a year more copper supply around 2020 than today.

It is forecasted that the copper deficit will shrunk from 600’000 tons to 200’000 tons. A slowdown in the demand growth is expected in the coming years from 2,5% to 1,9% of growth per year.

We also have to keep in mind that the global outlook is strongly influenced by China even though is rate of growth is declining. Furthermore, its economy is changing to an industry growing economy which demand a lot of copper supply to a consumption-based economy which has a lower demand.

Copper producers must nevertheless keep an eye on the market and introduce flexibility into their new project to ensure maximum profitability. Indeed, the slowdown in demand from the developed countries and the speed at which China demand slows remain uncertain and could affect producers’ new projects.

MMG Ltd plans after tax hike in Congo

After Glencore and ERG another foreign miner is reviewing its future production plans after the government increased taxes and removed investors safeguards.

MMG Ltd which is a Chinese state-owned enterprise is considering to invest in more expensive methods of mining the metal when existing oxide resources are exhausted.

Congo ranks alongside the United States as the world’s fourth biggest cooper producer and the largest source of cobalt. A supply change in Congo could have the potential to impact the cooper and cobalt prices, which have declined in the past due to that trade war between the U.S and China.

Forward curves

Current

Current

By comparing 2 forward curves below, we can notice some changes in the copper market. In the previous curve, the market was in the backwardation from march to April, meaning that the there was an undersupply situation. In the current curve, we are in contango. The market turns from a bullish to bearish market to an oversupply situation.

Spot Price

We can see a drop in the copper price during the month of February probably due to the Chinese New Year. Prices start to rise again on March as Chinese demand restart as well as the economic growth. The copper market is still undersupply which add even more pressure on prices.

Copper futures forward curve. MarketQview(online). 28thMarch 2019. (Consulted on 31th March 2019).
Available at the URL:http://marketqview.com/forwardcurvechart.php?ID=18&TYPE=Price
https://www.ft.com/content/2d2eef1e-5187-11e9-9c76-bf4a0ce37d49
Global copper market under supplied, demand on the rise — report (online). (Consulted on the 2nd April 2019)
URL:http://www.mining.com/global-copper-market-supplied-demand-rise-report/ Futures Forward Curve (online). (Consulted on the 2nd April 2019)
URL: http://marketqview.com/forwardcurvechart.php?ID=18&TYPE=Price https://markets.businessinsider.com/commodities/copper-price MMG Joins Glencore, ERG Reviewing Congo Plans After Tax Hike (Consulted on the 2nd April 2019) https://www.bloomberg.com/news/articles/2019-04-03/mmg-joins-glencore-erg-in-reviewing-congo-plans-after-tax-hike

Bulletin Freight N2 -Decrease in the Price


Mesurements: USD per container


As shown in the graph above, the price of  22nd March stands on 1280 USD. Comparing to last bulletin price (of the last day), the price dropped from 1’482 USD to 1’280 USD which represents approximately 13.6% decrease in the price which is significant.

This price decrease might be due to the price stabilizing after the increase that it held during the chinese new years (explained in the previous bulletin).

As a trading company, this significant decrease in the price of freight can represent an opportunity to increase the profit margin of the company (as there is a decrease in costs for a deal). It is possible that trading companies schedule the transport with the freight according to their expectations of the price movement but the price cannot be predicted with 100% certainty which means that it is not an easy task.

Freight risk –
The effect of the freight price on the trading company depends on the incoterm which the contract is referring to. In case the transportation costs are under the responsibility of the trader company , then the price volatility does affect the margin of the trader.

In contract, freight risk does not have this level of effect on trading companies like Cargil for example that use vertical integration (meaning that they would take the shipment operations under their responsibility as well as the actual trade). This means that not only the margin will increase due to the decrease in the number of involved parties but also means a decrease in price will drive costs down for the trading company.

Energy trader Mercuria gets green light to buy Aegean Marine Petroleum

In light of the new IMO 2020 regulations, shipping rates are expected to rise as vessels will need to buy fuel of better quality and thus more expensive.

Mercuria, the global energy trader, are going to buy Aegean Marine Petroleum. This company is a marine fuel Logistics Company that physically supplies and markets refined marine fuels to ships in port and at sea.

Mercuria sees the acquisition as key ahead of new rules on shipping fuel by the International Maritime Organisation (IMO) due to take effect next year.

We can see through this acquisition how freight rates and decisions regarding shipping could affect trading companies. They are now trying to have a larger control of the shipping sector as well.

Freight derivatives – Risk management tool  
Derivatives are used to hedge risk in the freight markets. Tankers are one of the most common means of transporting commodities such as oil and coal. Freight derivatives, such as swaps or forward freight agreements (FFA), can be used to protect ship owners against changes in freight rates. Commonly traded on the Baltic Exchange, dry (bulk) and wet (crude) freight derivatives are traded for particular routes and forward months in standardised sizes of vessel.

https://www.risk.net/definition/freight-derivatives

Cargill Net Drops 20 Percent, Revenues Fall as Trade Fight Bites

Cargill, the world’s biggest agricultural commodities supplier, reported 20% of drop in its fiscal second-quarter 2019 net earnings. The reason of company’s bottom line decrease is indeed due to the global trade tensions together with the challenges in the Chinese hog sector and a struggling U.S. dairy business . This drops shows again how volatile the commodity markets is and how the  the external factors can impact company’s net profit significantly.

Then, in regards to the Freight commodity, Cargill has additionally to this 3 business units, an “ocean transportation”units, more precisely “dry shipping services”, which is highly impacted by the U.S.-China trade fight as it brings uncertainty in the freight markets.

These 3 indexes behave quite similar, meaning that the reasons for the volatility of the price of freight for the 3 of them would probably be similar, however, effect each index in a different level.
For example : it is possible that the chinese new year had a greater effect on BDI than BHSI, as the change in the price was more significant. at the same time, it is possible to see that the timing of the trends is quite cohesive which makes their behaviour similar.  
https://www.pacificbasin.com/en/ir/industry.php

References :

https://www.pacificbasin.com/en/ir/industry.php

https://www.risk.net/definition/freight-derivatives

http://www.ampni.com/fup/fuels-32128.htm?lang=en&path=-234507605

Gasoline and Diesel fuel bulletin n°2

Two weeks ago, we have seen the composition of the gasoline price in the US, now as requested, here is a video which explains the composition of the price of gasoline in Switzerland

Unfortunately, the video is in german with french subtitles, it was impossible to find it in english.

In order to illustrate the seasonal pattern of the gasoline that we explained last week we can see the price in Switzerland per months.

Unleaded 95 :

https://www.erdoel.ch/fr/chiffres-faits/prix-de-l-essence/sans-plomb-95-moyenne-mensuelle

Unleaded 98 :

https://www.erdoel.ch/fr/chiffres-faits/prix-de-l-essence/sans-plomb-98-moyenne-mensuelle

Diesel fuel :

https://www.erdoel.ch/fr/chiffres-faits/prix-du-diesel/diesel-moyenne-mensuelle

The past few weeks have been very interesting in the oil market. Oil prices took a bit of a hit  and President Donald J. Trump has Tweeted on the 28 of March 2019 that OPEC should increase the flow of Oil in order to decrease Oil price. OPEC did not react to Trump’s Twitt.  Experts in the oil market have showed that Trump’s Twitt war with OPEC and Russia is waning. Indeed, even if the market react violently to Trump tweet on OPEC, it very quickly recover to its old price levels. Trump’s anti-OPEC rhetoric is clearly losing importance and impact.

Another important new in the Oil market is the Venezuelan crisis. Venezuela, which is a key Oil producer have shut down all operation due to issues the country is facing. During the past few weeks, China has sent humanitarian help to Venezuela when humanitarian aid from the US has been blocked along the Venezuela-Colombia border. Many people in the Oil industry believe that a trade war is taking place there.  When the US and other western countries are struggling with high Oil price, in China the situation is totally different. All trading houses in China are state-run companies. During the past week, Chinese companies have received orders from the Chinese government to produce more Oil even if the cost of production and storage is relatively high. For instance, Sinopec, one of the largest refiner and one of the two largest oil and gas producers in China has announced a fourfold increase in capital spending. This is a direct response to Beijing’s call for oil and gas companies to boost domestic production.

With thin profit margins in the oil sector, commodity trading houses have been looking for the next big movement in the energy industry. Trading giants such as Gunvor Group LTD, Trafigura Group Pte. Ltd and Vitol SA are all investing into the liquefied natural gas sector. They are all looking to buy more natural gas and therefore move away from dirtier and high pollution commodity such as crude oil. The world’s biggest commodity trading houses are looking to reshape the energy industry but they are also looking a new way to increase margin. The 27 March an article from Bloomberg has quoted Mr. Russel Hardy, the Chief Executive Office of Vitol who said that “ The liquified natural gas sector looks like a much younger crude market,it is an area that can grow and that is positive for trading houses”

To conclude, there were many important news related to Oil market, but what we can retain is that many important trading houses such as the Chinese Sinopec, have reported a huge drop in profit. For instance, Sinopec has reported a 76% drop in its latest quarterly profit for October- December 2018. The OPEC supply cut, the Venezuelan production shut down and the Iranian sanctions have  lead to the biggest inventory reduction when stocks normally increase at this time of the year.

When looking into the diesel situation specifically, there is a growing problem which is dubbed the illegal diesel trade. It is mainly present in the city of Dubai and the official has organised a dedicated task force in order to the tackle this growing problem. And that problem is that 62% of the companies inspected by that task force regularly trade illegal diesel. That illegality comes from the sulphur content in the diesel, which based on the Federal Cabinet Decision No. 37 of 2013 the sulphur content must be extremely low. Specifically, the content must not be over 10 parts per million (ppm) of sulphur. That 62% of companies were trading diesel barrels with sulphur content that far exceeded that limit. Not only is it a violation of the UAE, but also results in extremely harmful gas emissions.

http://theconversation.com/why-maduro-is-blocking-venezuela-bound-humanitarian-aid-when-so-many-people-in-his-country-need-it-111585

https://oilprice.com/Energy/Oil-Prices/Expect-Higher-Oil-Prices-As-OPEC-Clashes-With-Trump.html

https://oilprice.com/Energy/Energy-General/Whats-Keeping-Oil-From-Rallying-To-75.html