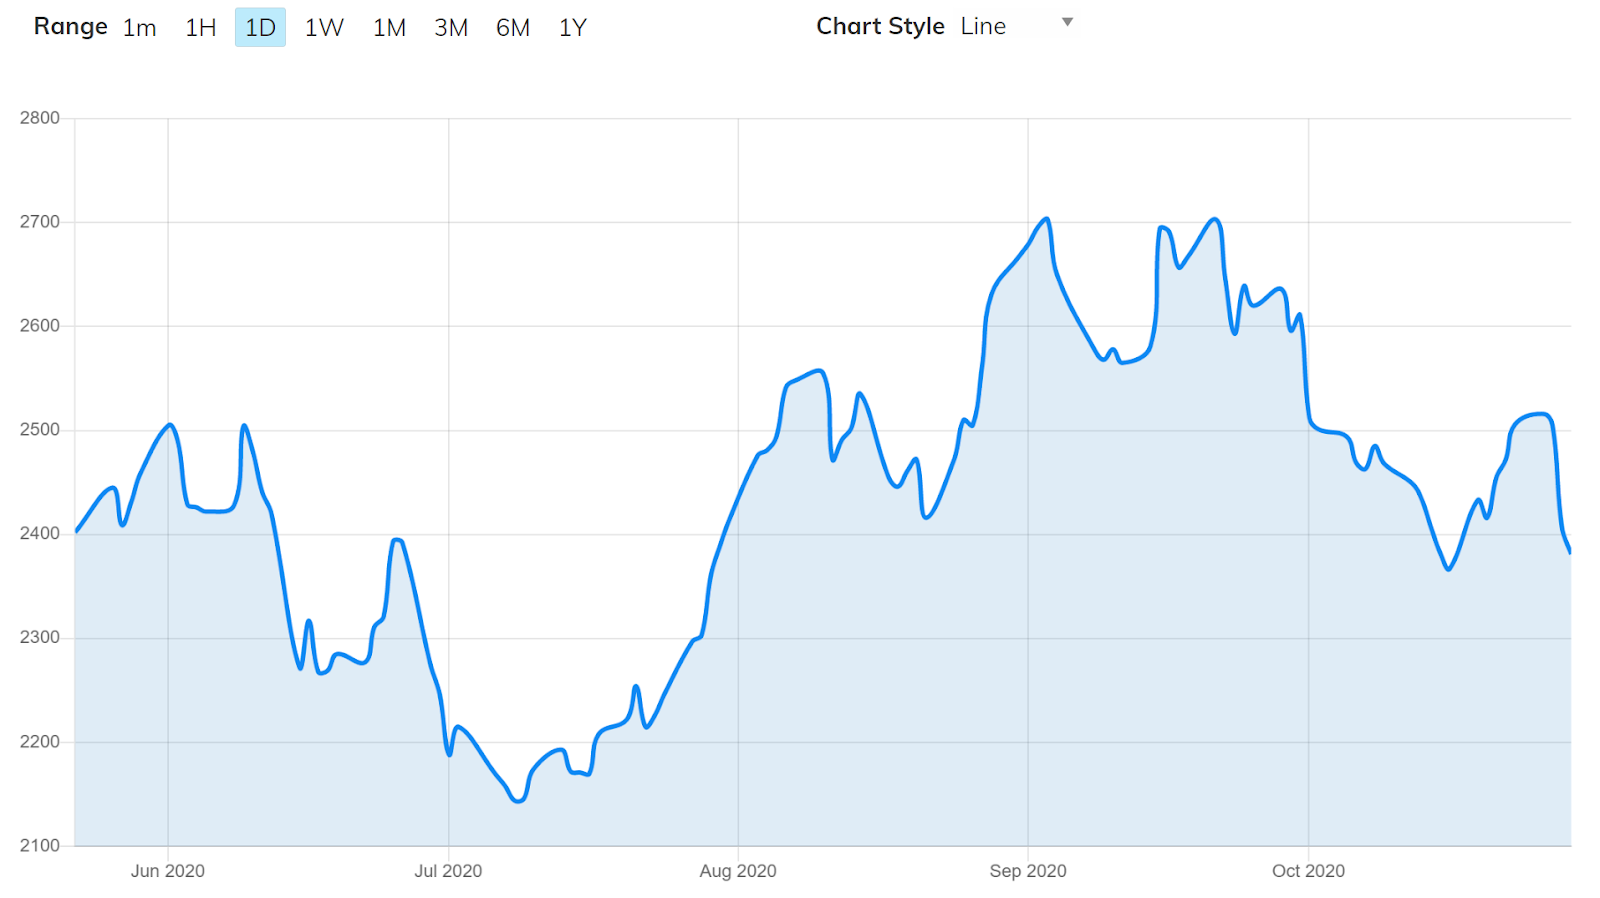
Can coffee & Cocoa demand recover? That’s the question

Price Recap


CFDs future Arabica coffee in USD/100 pounds


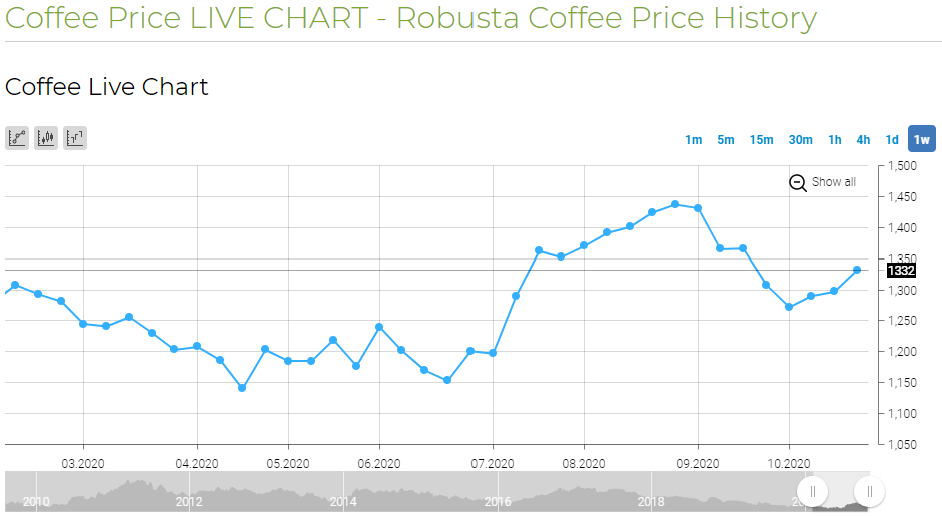
CFDs future Robusta coffee in USD/metric ton
Source: IFCmarketsSource: IFCmarkets
CFDs future cocoa in USD/metric ton
Source: Avatrade

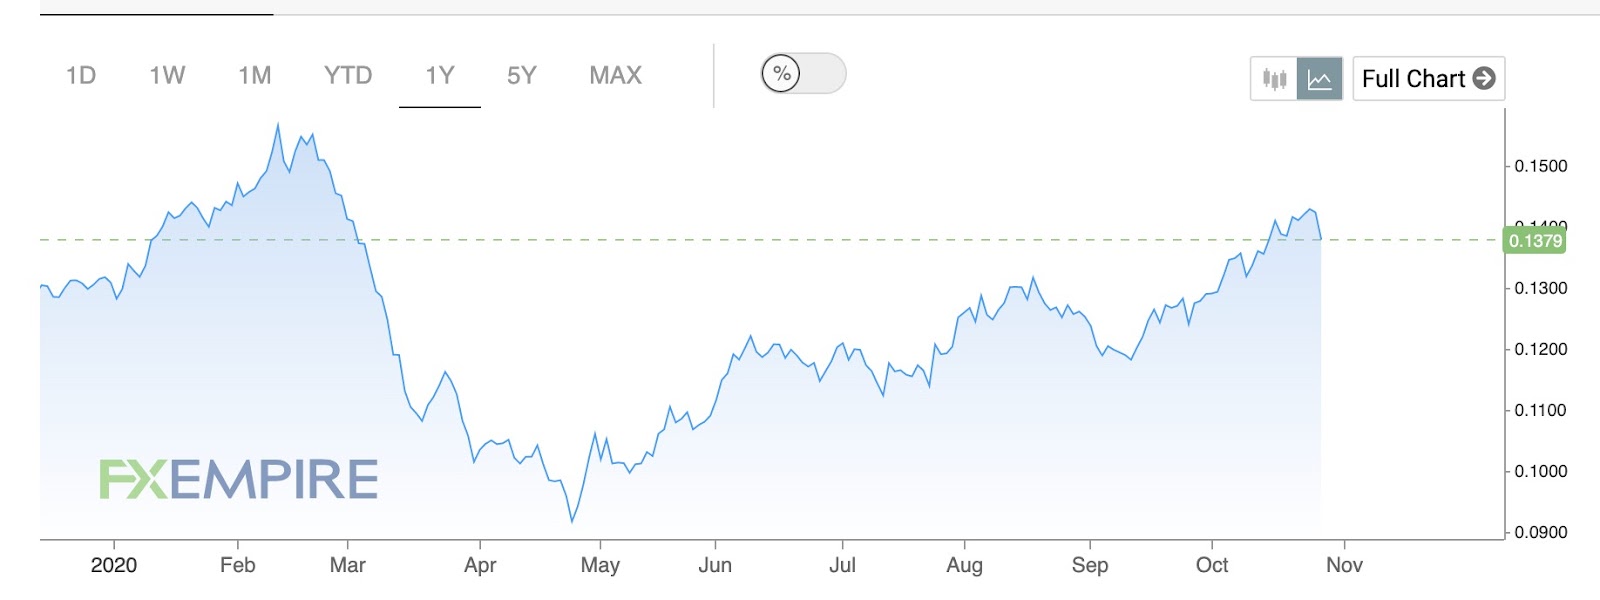
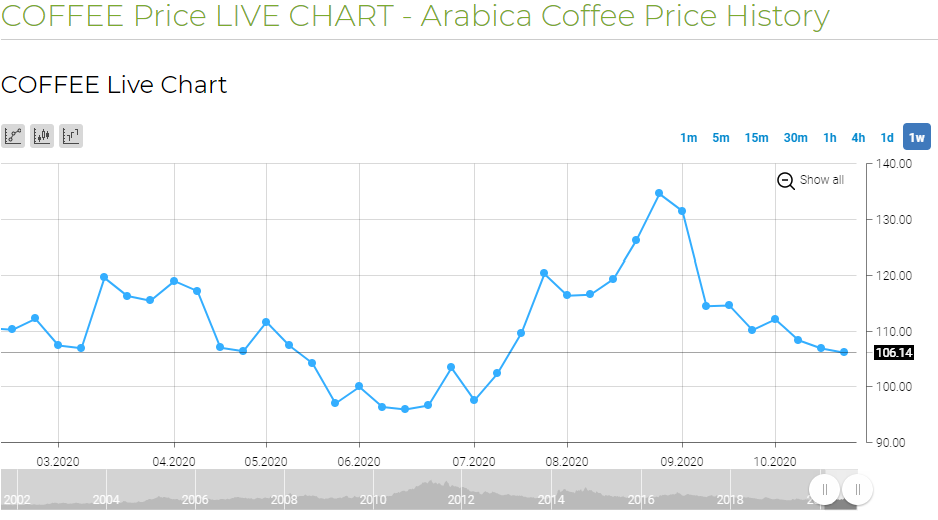
Both commodities, cocoa, and coffee beans experienced sudden drops in price at the end of the last summer. From USD 2703/MT in mid-September, the cocoa fell to USD 2381/MT on the 29th of October (-11.91%). The tendency is even more dramatic for Arabica coffee beans. The price drop reached -21.11% between early-September and end-October. However, Robusta coffee saw its price increase slightly between October 5th and October 29th (+4.95%).

These variations can be explained by the arrival of the second wave COVID-19. For the two last months, the spread among the population gained in intensity and with it the number of restrictions around the world. Naturally, the market is suffering from a demand contraction due to the closure of restaurants, businesses, and the recent lockdowns in several countries.

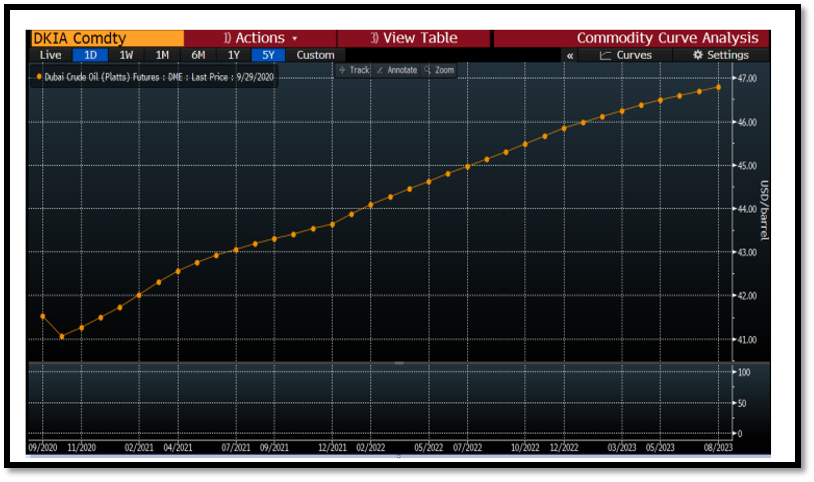
Futures and Cost Curves

For these two commodity futures, we can notice dramatic changes in December compared to the following months. Regarding the coffee, after the initial December drop, the curve is a contango. About the cocoa, the curve is harder to analyze due to several consecutive months of heavy curve variations.


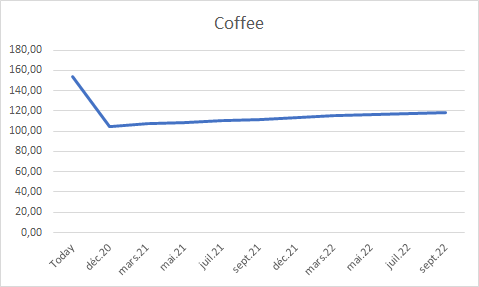
future coffee in USD/100 pounds


future cocoa in USD/metric ton
Source: BarchartSource: Barchart

Supply and Demand Dynamic

Coffee

On the supply side, the USDA has revised its forecast for 19/20. The world production is forecasted 2.4 Mio. bags below last December estimate to 166.9 Mio.bags. This is following revised yield due to weather conditions and some damages. Exports are down by 3.4 Mio. Vietnam revised yield accounts for most of the reduction in both production and exportable supplies. 

For 20/21 season is set to break records driven by Brazil with an increase of 9.1 Mio bags amounting 176.1 Mio. bags. This surge is based on good weather conditions prevailing in most coffee regions possibly resulting in a higher yield of the harvest.

Source: ICO, 2020 / * Forecasted / ** Annualised, please visit Ico.com for calculation methodology
Source: ICO, 2020

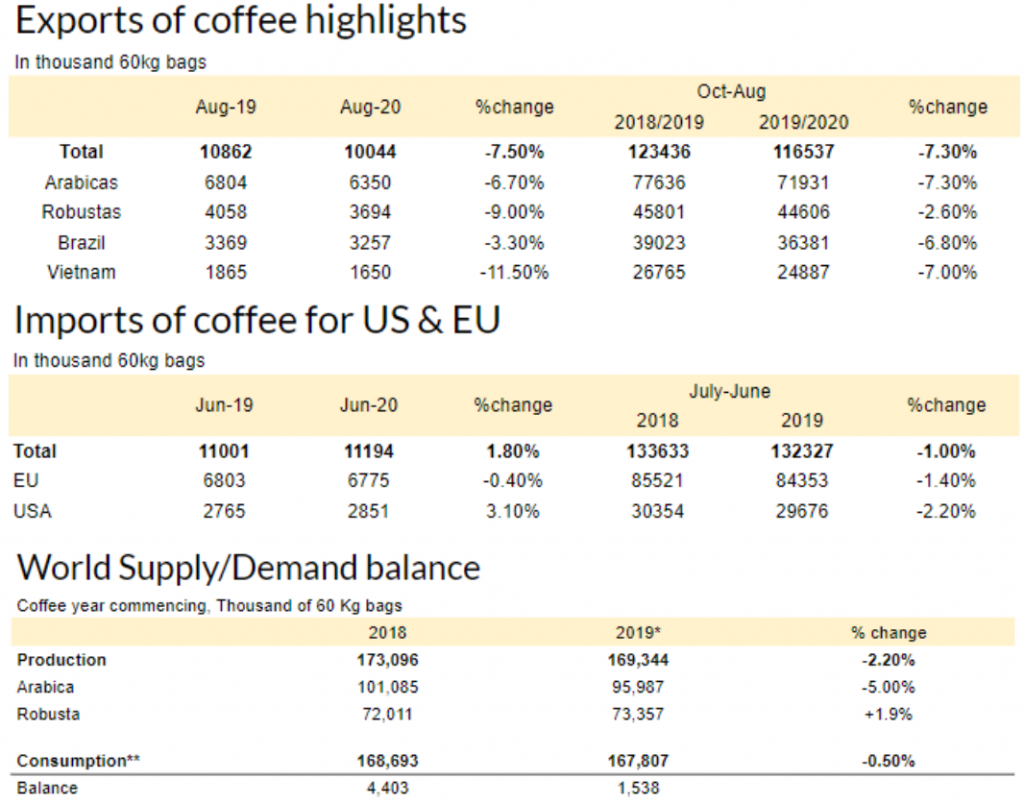
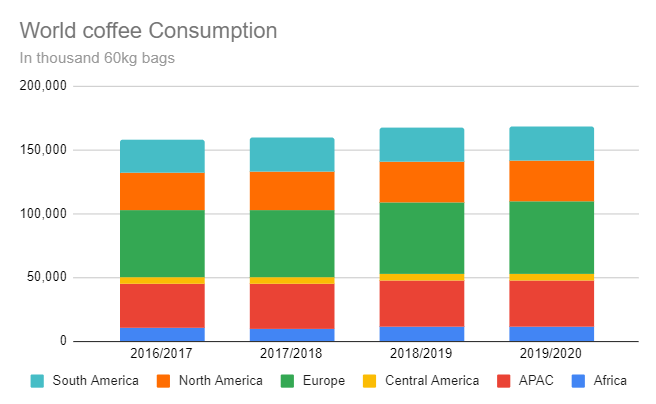
The yearly demand for 2020, both the US and Europe markets have been revised lower due to low consumption and stocks build-up. The US by 1.2 Mio. to 25 Mio. and Europe by 0.5 Mio. to 47.5 Mio. 

For 2021, both markets are set to each be up 2.0 Mio. bags from this year latest forecast. The EU would consumption reaches 49.5 Mio. bags. The ending stocks are expected to increase to 14.5 Mio. bags. On the US side, the total import would arise to 27.0 Mio. with ending stocks increasing 0.5 Mio. bags to 7.0 Mio bags. According to the USDA, the coffee market will be in surplus for season 20/21.

Cocoa

At the end of the 19/20 cocoa season, Côte d’Ivoire production reached 2.0 Mio Ton, down 4.8% YoY. The exports are down 2%. The start of 20/21 season, Ghana and Côte d’Ivoire announced a surge in farm gate prices. Up 28% and 21% YoY respectively. There are potential risks in exports linked to end of November election in Côte d’Ivoire. 

Demand, based on grinding data, is down 4.7 YoY in EU for 3rd quarter, might indicate that demand is not recovering. This decline is not as important as during the 2nd quarter of 2020 (16.3%). This is attributed to COVID-19 crisis.

Recommendation

Coffee

For coffee, based on falling consumption and production in 2020, the rising stocks in consuming countries as well as low-cost oil, the coffee price is expected to remain stable. For the longer term, the oversupply capacities of producing countries with uncertainties in consumption for the largest market might decrease prices further crossing the 1 USD/lb threshold. 

Cocoa

Like coffee, cocoa demand and the pace of re-opening of economies is the critical question. Therefore short term price, as well as long term, is expected to remain stable at 2300-2500 USD/Ton due to exports falling. The backwardation situation might be corrected by COVID-19 with continuous low demand.

Quentin Pilloud, William Béguin & Vincent Stalder

DiscLAIMER

This publication is for your information only and is not intended as an offer, or a solicitation of an offer, to buy or sell any investment or other specific product. The analysis contained herein does not constitute a personal recommendation or take into account the particular investment objectives, investment strategies, financial situation and needs of any specific recipient.  It is based on numerous assumptions

reference

Aboa, Ange. “Ivory Coast Struggling To Sell 2020/21 Cocoa Mid-Crop”. Reuters, 2020, https://www.reuters.com/article/instant-article/idUSL8N2HK4BE. Accessed 29 Oct 2020.

Carey N, Naidu R, Cavale S. Coffee, ketchup and Nike Air Max: it’s the COVID consumer economy. Reuters. https://www.reuters.com/article/us-health-coronavirus-consumer-pricing-i-idUSKBN25S4SB. Published 2020. Accessed October 28, 2020.

COFFEE Price Live | Arabica Coffee Price | Arabica Coffee Chart | IFCM. Ifcmarkets.com. https://www.ifcmarkets.com/en/market-data/commodities-prices/coffee. Published 2020. Accessed October 28, 2020.

Coffee Price Live | Robusta Coffee Price | Robusta Coffee Chart | IFCM. Ifcmarkets.com. https://www.ifcmarkets.com/en/market-data/commodities-prices/robusta. Published 2020. Accessed October 28, 2020.

Cocoa CFD – Cocoa Trading Conditions | AvaTrade. AvaTrade. https://www.avatrade.com/trading-info/financial-instruments-index/commodities/cocoa. Published 2020. Accessed October 28, 2020.

Coffee Prices and Coffee Futures Prices – Barchart.com. Barchart.com. https://www.barchart.com/futures/quotes/KCZ20/futures-prices?timeFrame=daily. Published 2020. Accessed October 28, 2020.

Cocoa Prices and Cocoa Futures Prices – Barchart.com. Barchart.com. https://www.barchart.com/futures/quotes/CC*0/futures-prices?timeFrame=daily. Published 2020. Accessed October 28, 2020.

ICCO. COCOA MARKET REVIEW SEPTEMBER 2020. 2020, https://www.icco.org/statistics/monthly-review-of-the-market.html. Accessed 29 Oct 2020.

ICO. Monthly Coffee Market Report – September 2020. London, 2020, http://www.ico.org/documents/cy2019-20/cmr-0920-e.pdf. Accessed 29 Oct 2020.

ICO. Monthly Export Statistics (Members & Non-Members) – August 2020. London, 2020, http://www.ico.org/prices/m1-exports.pdf. Accessed 29 Oct 2020.

ICO. Imports Of Coffee By Selected Importing Countries – June 2020. London, 2020, http://www.ico.org/prices/m4-imports.pdf. Accessed 29 Oct 2020.

ICO. Coffee Production By Exporting Countries. London, 2020, http://www.ico.org/prices/po-production.pdf. Accessed 29 Oct 2020.

ICO. World Coffee Consumption. London, 2020, http://www.ico.org/prices/new-consumption-table.pdf. Accessed 29 Oct 2020.

Ny Cocoa Closes At A 2 Week Lows On Concern Pandemic Lockdowns Will Curb Cocoa Consumption – Barchart.com. Barchart.com. https://www.barchart.com/story/futures/quotes/CC*0/futures-prices/533051/ny-cocoa-closes-at-a-2-week-lows-on-concern-pandemic-lockdowns-will-curb-cocoa-consumption. Published 2020. Accessed October 28, 2020.

Terazono E, Munshi N. Choc waves: how coronavirus shook the cocoa market. Financial Times. https://www.ft.com/content/37aa0ac8-e879-4dc2-b751-3eb862b12276. Published 2020. Accessed October 28, 2020.

USDA. Coffee: World Markets And Trade. Washington, 2020, https://apps.fas.usda.gov/psdonline/circulars/coffee.pdf. Accessed 29 Oct 2020.UBS. Agriculture: Food Price Risks Emerge. Züirch, 2020. Accessed 29 Oct 2020.

Sugar 1st Bulletin – The consequences of COVID-19 on the sugar market

Price movement recap

For this first bulletin, and in view of the current situation in the world, we will focus on the consequences of Covid-19 on the sugar market. The first graph shows the evolution of the sugar price for the year 2020. 

Like many other commodities, sugar is highly volatile. At the beginning of the year, prices have been rising steadily. Sugar prices reached a peak in February. However, in the months that followed (until almost the end of May), prices fell steadily. We can notice that this drop happened because of the worldwide lockdown period. Then, from the end of May until now, we can see that prices have a tendency to increase, although they have not yet reached the initial price before Covid-19 – more than 0.15 before the virus compared to 0.14 nowadays. 

Sugar prices in USD/pound

Available on: https://www.fxempire.com/commodities/sugar

Supply and demand dynamic  

As we can see in the graph below, consumption and production are almost equal, while the indicator price tends to decrease. 

Demand and supply are impacted by the COVID-19 pandemic but in very different ways. The importance of the virus today is slowing the growth in demand for sugar (quarantine, closing of restaurants/bars,…). On the other hand, the supply for sugar is increasing. This increase has two main causes: 

– due to the fall in the price of oil. Indeed, the price of ethanol is set according to the price of oil. If the price of oil falls, then the price of ethanol also falls (and vice versa). Since the beginning of the pandemic, the price of oil has been falling, which has lowered the price of ethanol. As a result, sugar producers are now focusing mainly on sugar production because ethanol production is uncompetitive 

– due to the reduced demand for ethanol. Indeed, during the quarantine period put in place because of the significant spread of COVID-19 , fuel consumption has decreased sharply.

Furthermore, the falling prices can be explained by the forecast of export which is going to be mainly from India. Indeed, India has accumulated lots of sugar stocks during the pandemic because of the lockdown. 

Available on: https://www.londoncg.com/covid19/industries/agricultural-business-aquaculture-fishing/sugar-mills/global-sugar-production-continues-despite-covid-19/

Available on:https://www.agriculture.gov.au/abares/research-topics/agricultural-outlook/sugar

Recommendations

Since we are in a backwardation position it is preferable to adopt a short position. Indeed, prices are falling down. As we are entering the second COVID-19 wave, the sugar market is facing lots of uncertainty, but we can predict that sugar consumption is probably going to continue to fall down and prices even. 

References

2020 – Agricultural Commodities vol.10 no.2, June quarter.pdf, [no date]. [online]. [Viewed 28 October 2020]. Available from: https://daff.ent.sirsidynix.net.au/client/en_AU/search/asset/1030381/10

Agricultural Commodities vol.10 no.2, June quarter 2020, 2020. . Vol. 10, p. 4.

Global sugar production continues despite COVID-19 – London Consulting Group, [no date]. [online]. [Viewed 29 October 2020]. Available from: https://www.londoncg.com/covid19/industries/agricultural-business-aquaculture-fishing/sugar-mills/global-sugar-production-continues-despite-covid-19/

SPYROSOFT, 2020. The Energy Series: The Brazilian Ethanol Market -. [online]. 7 September 2020. [Viewed 29 October 2020]. Available from: https://www.czarnikow.com/service/market_analysis/the-energy-series-the-brazilian-ethanol-market

Sugar | OECD-FAO Agricultural Outlook 2020-2029 | OECD iLibrary, [no date]. [online]. [Viewed 28 October 2020]. Available from: https://www.oecd-ilibrary.org/sites/3736a600-en/index.html?itemId=/content/component/3736a600-en#back-endnotea5z2

Sugar Price | FX Empire, [no date]. [online]. [Viewed 28 October 2020]. Available from: https://www.fxempire.com/commodities/sugar

Copper – Bulletin #1

Price movement recap – Historical and Forward curve

HISTORICAL (over last year)

The price of copper on the London Metal exchange from 10/29/2019 to 10/27/2020

Available from: https://www.lme.com/en-GB/Metals/Non-ferrous/Copper#tabIndex=2

The price on the Y-axis is in US dollar per tonne.

The big fall downs of January and March are provoked by the economic consequences of the COVID-19 crisis. China being the main importer of Copper, its initial lockdown hugely decreased its production- and investment- activities (so demand) while the production, especially the top ten copper producers, increased by 1% compared to the first quarter of 2019[i]. As the impact of the COVID did not occur at the same time between the supply (non-Chinese, mainly South America) and the demand (mainly China through its role as the main importer), the prices decreased drastically. The price of oil has also decreased during that period (Q1 2020)[ii], it has decreased the production cost of copper, and subsequently played a role in the decreasing price of that commodity.

FORWARD CURVE

Forward curve as of 10/28/2020 as per data of Chicago Mercantile Exchange

Available from: https://www.cmegroup.com/trading/metals/base/copper_quotes_globex.html?optionProductId=797&optionExpiration=797-X0

Price for one pound of copper in US dollars

The above graph represents the price of copper today based on future delivery. We can notice for the period from November to December 2020 a backwardation, (estimated low supply). The period from January to March 2021 represents a contango (estimated good/high supply) and the following periods until December 2021 represent that supply and demand are estimated to be stable.

Considering the increase of cases in Europe resulting in a market index falling by 2%, the demand for copper decreases with the declining economy[iii]. Nevertheless, China shared a possible availability of the COVID-19 vaccine as early as December resulting in a lift of the price of copper[iv].

The speculations regarding the outcome of the US elections, impacting the strength of the dollar, do impact the demand for copper since this commodity is traded in the US dollar currency.[v]

Illustration of the supply and demand dynamic of the commodity

LME Copper Warehouse Stocks level from 10/1/2019 to 10/28/2020

Available from: http://www.copperenews.com/copper-warehouse-stocks.asp

1year Copper Warehouse stock level.

The effect of Covid-19 started to be felt after 31 March 2020. Since the production companies had to lower the number of workers which led to smaller production. But since the economic activity was too slow, the slow over the production didn’t impact the stocks up until the economy started picking up again in June 2020, and we can notice a drop in the Copper stock from jun2020 to October 2020 due to these reasons and also the price rise of copper during that period. In October 2020 we can notice that the stock of copper is getting higher while the price is getting lower.

Recommendations: short (sell) or long (buy) for next 3 to 6 months

For November and December 2020 we have a backwardation we advise selling. Since the buyer is ready to pay a premium today for the product. For December our advice is to buy to make a profit in January by selling. The uncertainty planning with the COVID-19 pushes us to plan only for the 3 upcoming months.

Article by Ismail MODAFFAR IDRISSI, Tashi JARRON & Amélia REUSSER


[i] BASOV Vladimir, Largest Copper Producers Worldwide : Q1 2020 Overview [online],  MINING NEWS & INTELLIGENCE, July 3rd 2020, consulted October 29th 2020, available from: https://www.minesandmetals.com/2020/07/largest-copper-producers-worldwide-q1-2020-overview/

[ii] TRADING ECONOMICS, Brent Crude Oil, consulted October 29th 2020, available from: https://tradingeconomics.com/commodity/brent-crude-oil

[iii] JONES Huw (Reuters), Europe trumbles 2% on COVID curbs and Brexit impasse [online], INVESTING.COM, October 15th 2020, consulted October 29th 2020, available from: https://www.investing.com/news/economy/asian-stocks-mixed-on-fading-us-stimulus-hopes-virus-concerns-2324823

[iv] P.SAEFONG Myra, Copper futures post highest finish in over 2 years [online], MARKETWATCH, October 20th 2020, consulted October 29th 2020, available from: https://www.marketwatch.com/story/copper-futures-head-for-highest-finish-in-over-2-years-11603213007

[v] Bloomberg, JPMorgan says Trump win could spur US Stocks, Dent Asia Assets [online], INVESTING.COM, October 28th 2020, consulted October 29th 2020, available from: https://www.investing.com/news/stock-market-news/jpmorgan-says-trump-win-could-spur-us-stocks-dent-asia-assets-2334707

Oil market uncertainties: Covid-19, the American elections and the Asian economy – Gulf oil – Weekly bulletin #1

Price movement recap

Price is in USD / Barrel

The violent sell off we have just been through this week and at the end of September is very correlated with the negative ‘narrative’:

  • China has loosely mentioned a net carbon neutral target by 2060.
  • Joe Biden’s likely victory leading to the ‘imminent return of Iran’ and a 2nd push for renewable energies contributed to push the oil price down.

Looking at 2021, China is planning to double its net import coverage through SPR (strategic petroleum reserves).  This positive news is not sufficiently important to push the oil price up but it provides support to maintain price levels. moment.

Price is in USD / Barrel

Futures prices / Cost Curves:

The Gulf Oil market is in contango as shown in the 1st graph below. Due to the Covid-19, supply remains higher than demand which increases the premium (storage+financing).

On the 2nd graph dated 3 weeks ago, the contango situation was similar.

Supply and demand dynamic

As you can see on the graph, OPEC’s crude oil production has decreased significantly as a result of the pandemic. However, there has been a small increase thanks to the return of the largest Libyan field.

Demand declined in the second quarter of 2020 due to Covid-19. Because of confinement, the petrol consumption decreased (cars and planes). At the same period last year, the demand was higher by 0.7 mb/d.

In our opinion, the decrease in demand will continue due to the 2nd virus wave and the new measures to counter the virus spread.

On the positive side, we see that Asian oil demand is coming back, which is expected to be a major catalyst in Q4. Physical markets are strengthening there because Covid-19 is better controlled and an economical takeover is expected.

Recommendations

As shown above, the oil market is in contango. From an investment perspective, we recommend being long for the next 3 to 6 months. We think that due to the pandemic, the demand will remain low, especially during the 2nd wave in which we are currently in. The oversupply increases the storage costs and raise the today’s contractually agreed prices for future deliveries. The unbalance between supply and demand, currently in favor of supply, creates a situation in which investors should be long.

Abbas Al-Azawi

Alexis Baeriswyl

Valery Sikorskiy

References

BOURSE, Zone, [no date]. PÉTROLE BRENT (LONDON BRENT OIL) : Graphique de Cours Comparatif | XBNT | XX00000BRENT | Zone bourse. [online]. [Viewed 28 October 2020]. Available from: https://www.zonebourse.com/cours/matiere-premiere/LONDON-BRENT-OIL-4948/graphiques-comparatif/

Dubai Crude Oil (Platts) Financial Futures Quotes – CME Group, [no date]. [online]. [Viewed 27 October 2020]. Available from: https://www.cmegroup.com/content/cmegroup/en/trading/energy/crude-oil/dubai-crude-oil-calendar-swap-futures.html

Le pétrole récupère au lendemain d’une forte chute, 2020. Allnews [online]. [Viewed 27 October 2020]. Available from: https://www.allnews.ch/content/march%C3%A9s/le-p%C3%A9trole-r%C3%A9cup%C3%A8re-au-lendemain-d%E2%80%99une-forte-chute

London open: Hopes for oil reprieve on reports of China SPR buy-up, [no date]. FXStreet [online]. [Viewed 27 October 2020]. Available from: https://www.fxstreet.com/analysis/london-open-hopes-for-oil-reprieve-on-reports-of-china-spr-buy-up-202004020828

SHEPPARD, David, 2020. Oil traders braced for balancing act in wake of US election. [online]. 27 October 2020. [Viewed 28 October 2020]. Available from: https://www.ft.com/content/00f63355-c1fa-4cf8-ad18-450c12440106

This Week in Petroleum, [no date]. [online]. [Viewed 29 October 2020]. Available from: https://www.eia.gov/petroleum/weekly/

Westbeck Capital Management LPP, 2020. Monthly Newsletter [medium]. London: Westbeck Capital, september 2020.

Organization of the Petroleum Exporting Countries, 2020. OPEC Monthly Oil Market Report [online]. Vienna: OPEC, 13 october 2020. Available from: https://www.opec.org/opec_web/en/publications/338.htm