LNG – Bulletin 3 – January 2021

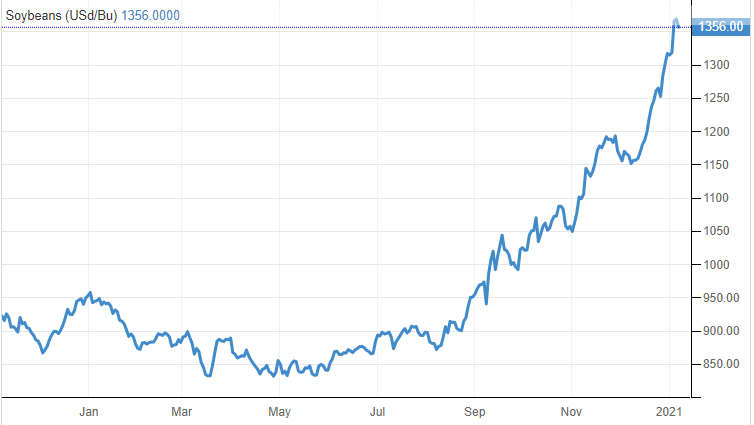
Price movement, demand & supply analysis

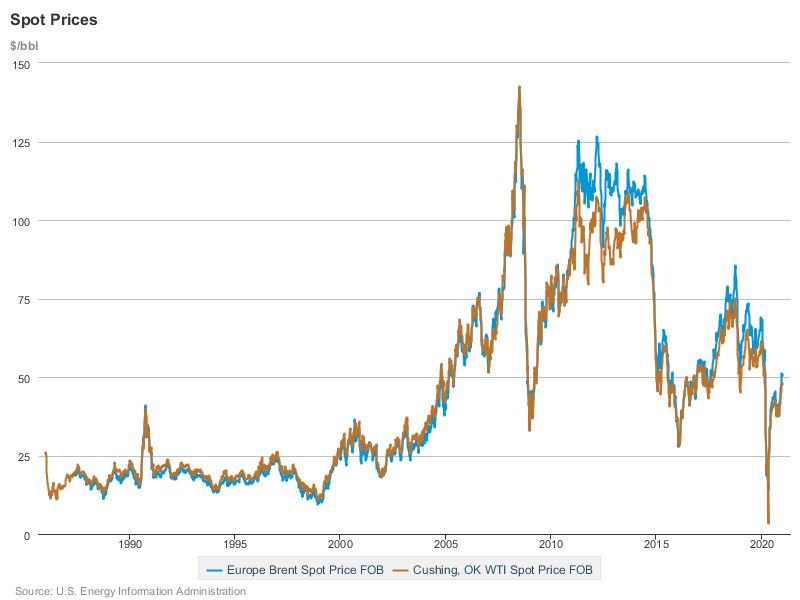
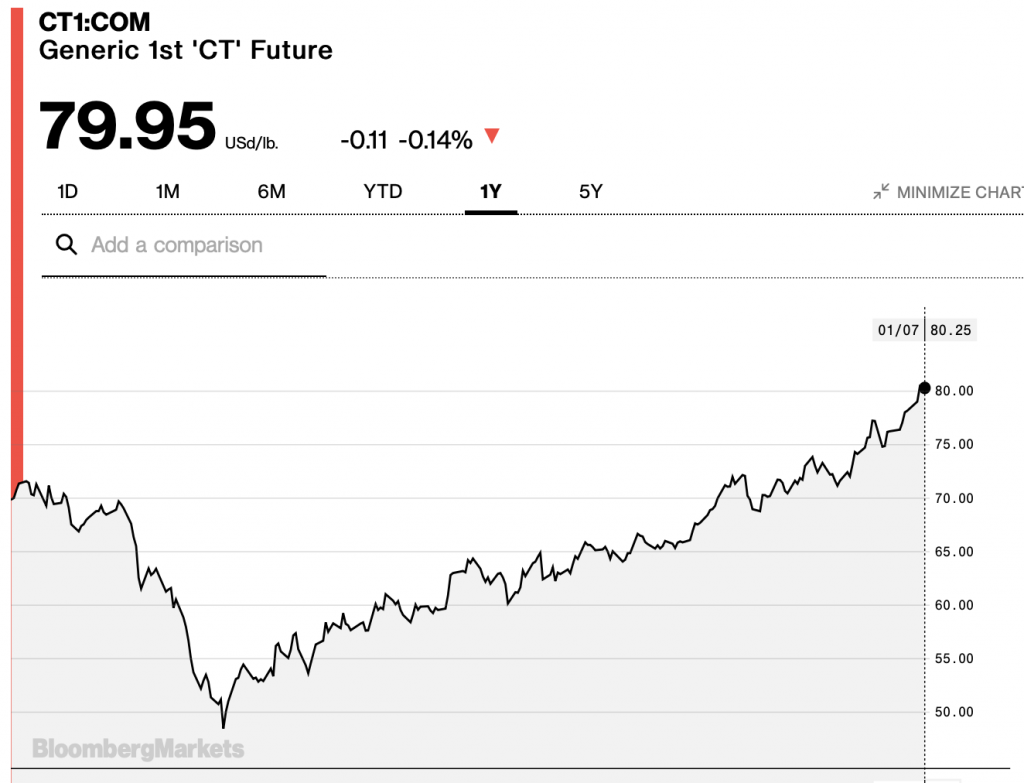
We can see on the graph above that the price of Natural traded on the Henry hub benchmark was traded at 2.77 $ per Million BTu on the 5th of January 2021. As expected due to the high seasonality of this commodity, the price is increasing during the winter period where the household consumption is at its highest. Moreover, the worldwide demand for LNG on the Asian market  is skyrocketing  this year due to an intense cold-weather. However, even if the prices are increasing over the winter period due to an increase of the worldwide demand, the prices tend to converge and decrease within this global market because technological  improvement (fracking) have attracted more and more players thus decreasing the production cost of this commodity.
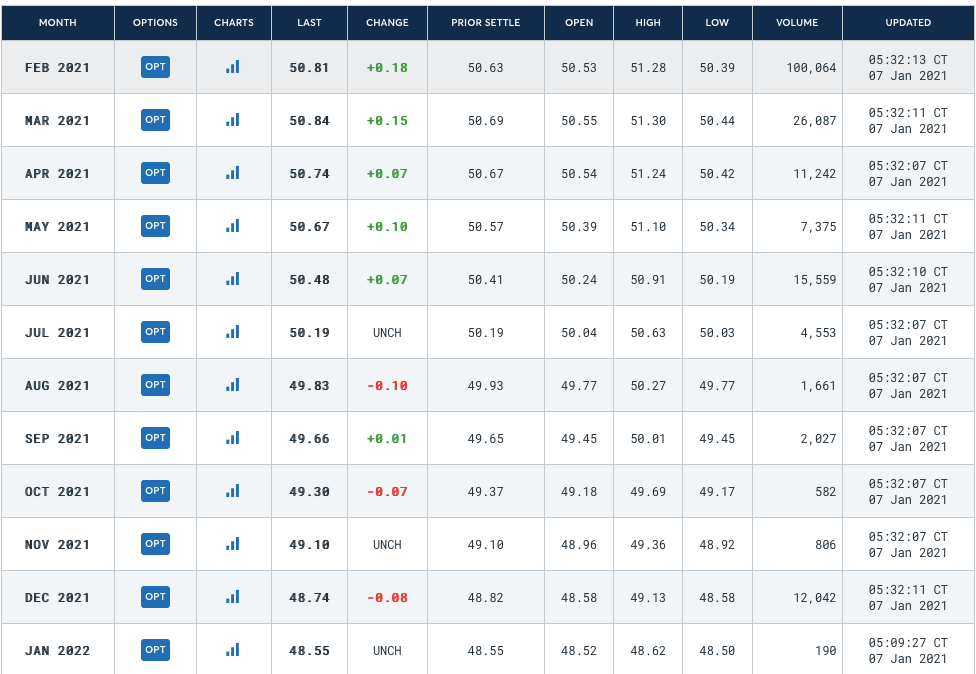
Futures:

The coupled cost decline and regional shifts in demand and supply regarding LNG is the main driver for a strong forecast growth in this market. Liquefaction of natural gas has been around for over a hundred years but technological improvements and new energy consumption trends have transformed the market. China and Europe will continue to experience increasing deficits in their natural gas production whereas North America will show a strong gas surplus resulting in growing LNG exports around the world. Another aspect of LNG is that global liquefaction and regasification capacity will improve and grow together more than the double of today’s levels. Furthermore, due to increasing average shipping distance, tankers transporting LNG will increase their gas transport market share and tonne-miles shipping is expected to quadruple.

A therm (thm) equals 100’000 British thermal units (Btu).

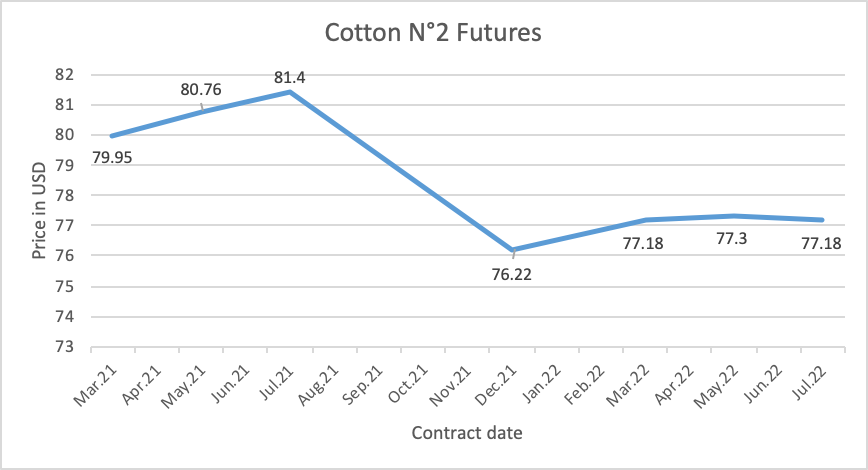
Here the main change and point of observation is the increase in prices for future deliveries between February 2021 and February 2022. Indeed, recent important increases in demand due to cold snap, especially in Asia where we find the three biggest liquefied natural gas world importers, have led to a significant appreciation of short-mid term LNG prices traded as of 6th January 2021. But on a  longer term, prices converge again on a lower basis.

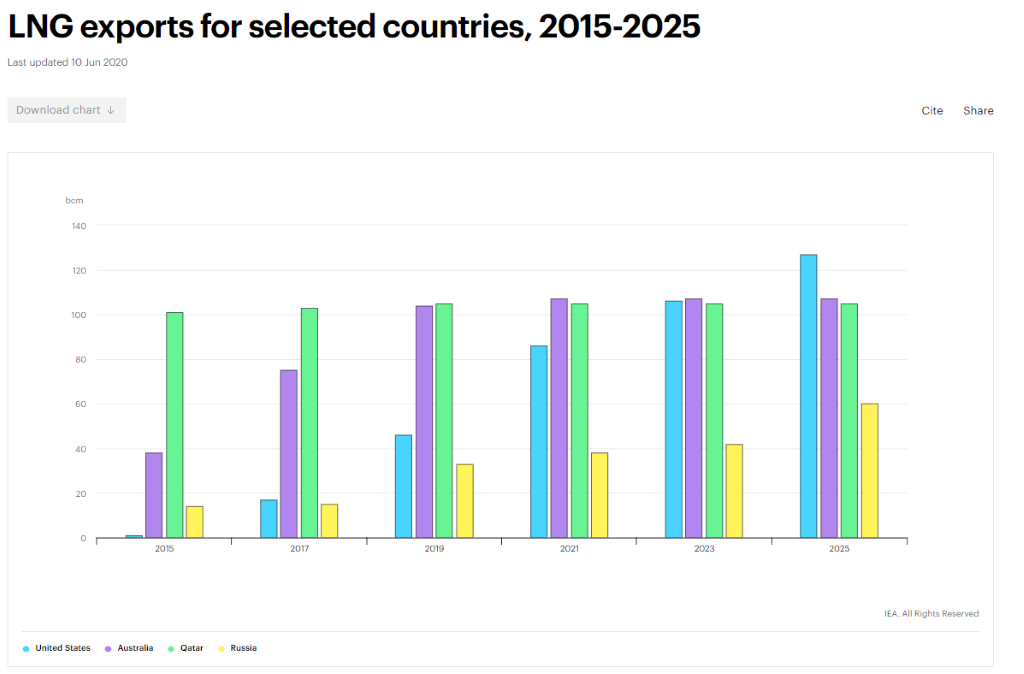
On the previous graph, we can observe the evolution of gas exports by destination from Australia. The main part of the Australia LNG is exported to those following three countries: China, Japan and South Korea. According to the other graph we can see that Australia is going to surpass Qatar as the world’s largest liquefied natural gas exporter. This is mainly due to the fact that Australia’s newly commissioned projects ramp up and operate at full capacity (Wheatstone, Ichthys and Prelude floating LNG projects). Another interesting aspect is concerning the increase of export from the U.S which is expecting to be the country leader by 2025. Five projects are under construction totaling 47.8 MMtpa of liquefaction capacity. More than 30 additional LNG export projects have been proposed for the development of LNG export.

Recommendation:

Since for this coming winter market is expected to go in backwardation for the coming months with the analysis made by NGSA, we recommend selling now and do not store the commodity. In addition, as we are in the second wave of the COVID-19 LNG market is becoming uncertain as every commodity we can only plan for the coming month.

Bibliography

Henry Hub Natural Gas Spot Price, [no date]. [online]. [Viewed 7 January 2021]. Available from: https://ycharts.com/indicators/henry_hub_natural_gas_spot_price

Asia LNG Prices Skyrocket as Buyers Scramble for Supplies Amid Cold Snap, Power Shortages, 2021. Natural Gas Intelligence [online]. [Viewed 7 January 2021]. Available from: https://www.naturalgasintel.com/asia-lng-prices-skyrocket-as-buyers-scramble-for-supplies-amid-cold-snap-power-shortages/

U.S. Energy Information Administration (EIA), [no date]. [online]. [Viewed 7 January 2021]. Available from: https://www.eia.gov/naturalgas/weekly/#tabs-supply-3

LNG supply and demand, [no date]. [online]. [Viewed 7 January 2021]. Available from: https://eto.dnvgl.com/2019/lng-supply-and-demand

UK Natural Gas Futures Curve, [no date]. ERCE [online]. [Viewed 7 January 2021]. Available from: https://www.erce.energy/graph/uk-natural-gas-futures-curve/

LNG exports for selected countries, 2015-2025 – Charts – Data & Statistics, [Viewed 7 January 2021]. IEA [online]. [Viewed 7 January 2021]. Available from: https://www.iea.org/data-and-statistics/charts/lng-exports-for-selected-countries-2015-2025

Australia Exports By Country, . [online]. [Viewed 7 January 2021]. Available from: https://tradingeconomics.com/australia/exports-by-country

3rd Bulletin : North American Oil

Price movement recap

Oil prices have surprisingly increased in the first week of January. It happened after Saudi Arabia said its oil production will be cut by 1 millions barrels per day in addition to OPEC+’s reduction. Crude oil prices are influenced by Energy Information Administration’s (EIA) and the American Petroleum Institute’s (API) reports.

https://www.eia.gov/dnav/pet/PET_PRI_SPT_S1_W.htm

Forward curve 07.01.21

Currently the future market for WTI is quite flat but with a small trend of  Backwardation: opposite of contango.  The spot price for delivery now is higher than today’s price for delivery in the future. Demand is greater than supply now. So, people are ready to pay a premium for delivery today. It sends a message to suppliers: supply me! don’t store! Don’t store!!

This may be due to the uncertainty about the current global economic condition and the fact that COVID cases have risen during the Christmas holiday. But at the same time, recent vaccines are starting to bring some hope about the market.

Therefore it explains the current feeling of uncertainty about the market.

https://www.cmegroup.com/trading/energy/crude-oil/light-sweet-crude_quotes_globex.htm

Inventory levels

According to the Energy Information Administration, there was a draw of 8 million barrels in 2020’s last week. This news made oil prices rise. This report was done the day after the American Petroleum Institute’s approximation was a draw of 1.66 million barrels, but accompanied by a significant gasoline inventory build and middle distillates of respectively 5.47 and 7.14 million barrels.


United States Crude Oil Inventories (investing.com)

Recommendation

Due to the encouraging news about vaccines the market seems to have seen the worst.  Different pictures are present in the main shale oil industry. As most producers do not break even at current rates, some are pessimistic about their future. Others are positive, and among analysts there is also a possibility that the EIA and the industry itself are purposely gloomier than they need to be in order to get OPEC+ to continue its production cuts in order to keep prices higher.

 Although prices have been helped by these cuts, volatility exists because not only supply decides where the industry goes, but also demand, which is arguably a far more significant factor right now. And the future remains highly unpredictable when it comes to demand, as Forbes’ David Blackmon noted in a recent post. 

In the United States, the pandemic is still raging, vaccines are provided much slower than expected, and this means that the long anticipated return to normal will come longer than many hoped, even in the oil and gas sector, if it ever does. It will inevitably be all about cost and competition again, just as it was during the last crisis in the oil industry. Last time, with substantial support from oilfield service providers, U.S. shale pulled it off, and it ended up leading the boom in U.S. oil production that turned the nation into the biggest producer in the world. The first signs of what is to come later this year will be presented and whether the industry will be able to rebound as strongly from this crisis.


https://oilprice.com/oil-price-charts/45

Compared to our last bulletin where the price was at $44.70 and now raising to $50.72 per barrel (price today for delivery in early January) the recommendation was to be long (buy) for the next 3-6 months and still the same as of today. The future consumption of oil is expected to rise continuously throughout the year, since the arrival of the pandemic’s protection and the limitation of production. The market being well supplied will be contango. Prices are going up month after month. Therefore it will be interesting to buy and sell in future contracts with the higher price from the market to cover also the storage costs. 


Bibliography

SLAV Irina, 2021 Oil Jumps On Major Crude Inventory Draw [online] [Viwewd 6 January 2021] Available from: https://oilprice.com/Energy/Energy-General/Oil-Jumps-On-Major-Crude-Inventory-Draw.html


SLAV Irina, 2021, U.S. Oil Executives Cautiously Optimistic About 2021 [online] [viewed 7 January 2021] Available from https://oilprice.com/Energy/Energy-General/US-Oil-Executives-Cautiously-Optimistic-About-2021.html


PETROLEUM & OTHER LIQUIDS [online] [viewed 6 January 2021] Available from https://www.eia.gov/dnav/pet/PET_PRI_SPT_S1_W.htm


CRUDE OIL – OVERVIEW [online] [viewd 6 January 2021] Available from https://www.cmegroup.com/trading/energy/crude-oil/light-sweet-crude_quotes_globex.htm


SLAV Irina, 2021, Oil Jumps On Major Crude Inventory Draw[online] [viewed 7 January 2021] Available from https://oilprice.com/Energy/Energy-General/Oil-Jumps-On-Major-Crude-Inventory-Draw.html

Cotton – Bulletin N° 3

News & Price fluctuations

Available from: https://www.bloomberg.com/quote/CT1:COM

Cotton price (7th January 2021 : 80.25$) is higher than at the same time last year and it is at its highest level in nearly two years, thanks to a lack of rainfall in key-growing regions that has reduced expectations for the current crop. The U.S. Dept. of Agriculture expects the smallest domestic crop in five years. We can also add the recent scandal on forced labour in China (which produces 85% of China’s cotton and 20% of the global supply) that has put off many clothing makers and the US has banned China’s cotton in response to the scandal. All these events explain the rise in price of Cotton.

Cotton Supply & Demand

According to the latest estimate of the US Department of Agriculture made in December 2020, the imports of cotton are projected at 43.2 million bales which is 7.4% above last season. This major increase is mainly due to China which increases its imports due to higher local prices.

Available from: https://www.ers.usda.gov/webdocs/outlooks/100030/cws-20k.pdf?v=1556.8

Production is projected at 113.9 million bales which is 8.2 million bales less than last season. The major reductions are in the United States, Brazil and Pakistan because of severe weather issues such as droughts, floods, hurricane, and so on that resulted in many abandoned acres.

Consumption is projected to increase by 13% to 115.6 million bales in 2020/21. This is mainly due to the fact that Covid-19 and the slowdown of the world economy it has caused, has led to a major reduction in world cotton demand in year 2019/20, so it is quite easy to perform better in 2021. Nevertheless, Covid-19 has not disappeared yet, and therefore 2021 brings its lot of uncertainties as well, even though the hope created by the vaccine has led to more optimistic projections for 2021, these projections are still below the volumes from previous years that were over 120 million bales.

Available from: https://www.ers.usda.gov/webdocs/outlooks/100030/cws-20k.pdf?v=1556.8

World stock of cotton are expected to decrease in many countries this season mainly because of the above-mentioned reasons, but it will be partially offset by an increase in production in India. China’s stock continues to decrease, nevertheless it remains the largest cotton stockholder in 2020/21 accounting for 37% of global cotton stocks.

The latest cotton supply and demand estimates show that world cotton stocks are projected to decrease by 2% in 2020/21 to 97.5 million bales against 99.4 million bales in 2019/20.

This could explain our future curves which is in contango till July 2021 and ends up in backwardation between July and December 2021. It could be explained by the fact that as we have seen demand will be higher than supply in 2020/21. We might imagine that till July 2021 the contango is explained by the fact that the 2019 crop will still be available until then.

Data available from: https://www.theice.com/products/254/Cotton-No-2-Futures/data?marketId=5739902

Recommendations

The recent events concerning forced labour and the fact that USA has banned China’s cotton affects the price on the rise. That is why we need to have a close look at what is happening in these countries and how the market will change with the covid19 pandemic.

Futures prices are arising at least until July 2021 where it will be valued at 81.4 USD, so the best action to take for now is to go long on cotton investment.

Bibliography

BATHA, Emma, 2020. China accused of forcing 570,000 people to pick cotton in Xinjiang. Reuters [online]. 15 December 2020. [Viewed 4 January 2021]. Available from: https://www.reuters.com/article/china-cotton-forced-labour-trfn-idUSKBN28P2CM

CAMPICHE, Dr Jody, 2020. GOODBYE 2020: Cotton Outlook Hinges on Economic Recovery, Demand. Cotton Grower [online]. 28 December 2020. [Viewed 5 January 2021]. Available from: https://www.cottongrower.com/market-analysis/goodbye-2020-cotton-outlook-hinges-on-economic-recovery-demand/

Cotton Market Fundamentals and Monthly Cotton Price Outlook, [no date]. [online]. [Viewed 4 January 2021]. Available from: https://www.cottoninc.com/market-data/monthly-economic-newsletter/

Cotton No. 2 Futures | ICE, [no date]. [online]. [Viewed 5 January 2021]. Available from: https://www.theice.com/products/254/Cotton-No-2-Futures/data?marketId=5739902&span=2

Cotton Prices Rise as Lack of Rain Shrinks Crop – WSJ, [no date]. [online]. [Viewed 4 January 2021]. Available from: https://www.wsj.com/articles/cotton-prices-rise-as-lack-of-rain-shrinks-crop-11609764658

CT1 Commodity Quote – Generic 1st “CT” Future – Bloomberg Markets, [no date]. [online]. [Viewed 7 January 2021]. Available from: https://www.bloomberg.com/quote/CT1:COM

ICAC, [no date]. [online]. [Viewed 6 January 2021]. Available from: https://icac.org/News/NewsDetails?NewsId=2336&YearId=2020

WWW.FIBRE2FASHION.COM, [no date]. Global cotton prices now exceed pre-pandemic levels: USDA. [online]. [Viewed 5 January 2021]. Available from: http://www.fibre2fashion.com/news/textile-news/global-cotton-prices-now-exceed-pre-pandemic-levels-usda-271380-newsdetails.htm

Soybean – Bulletin 3 – 2021

PRICE MOVEMENTS & INVENTORY LEVEL


Source: Trading Economics


Source: CME Group & USDA

The current situation of the soybean market is that the US soybean prices are still increasing and are likely to continue in 2021. This increase is due to the fact that exports are still growing and that China shows a strong demand. 

The  graphs above confirm our statement from the last Bulletin, meaning that the supply is tight because of the end of the both major suppliers’ harvest, Brazil and US. Additionally, as already said, the production of soybeans in Brazil and Argentina is uncertain because of the La Niña phenomenon. Without forgetting the global pandemic crisis.  

China is the most important US soybean buyer as they account for over 58% of total export according to the USDA. Additionally, China is expected to continue its intense purchasing as the country is expected to totally recover from the African swine fever disease. 

US soybeans prices are expected to continue its increase as the domestic crushing are rising and the ending stock will be lowered.

The demand for soybean meal-based animal feed has increased because of meat exports and soybean oil increased because of the rise of biodiesel purchases.

As a reminder, the agreement between the United States and China suggests that China will buy at least 36.5Bn US$ worth of American agricultural product in 2020. 

GLOBAL WARMING AND LA NIÑA

As we have seen this year, the harvest of soybeans has been altered by La Niña, which is a meteorological condition responsible for the low level of rainfalls resulting in a delayed plantation. The underlying issue might be more complex though, since global warming is known to be an accelerator of La Niña. In fact, scientists do not seem to have a definite answer, but the phenomenon could take place more frequently and be more pronounced, which could make the soybean production – and ultimately supply – even more uncertain in the next few years. 

Since La Niña takes place in the Pacific Ocean and, one solution to meet the demand needs – and thus avoid price levels going through the roof – could be an increase in production in other major producing countries located elsewhere, for example in India and China, which could partially ensure its increasing local demand. One issue persists though, which is the fact that China is also hit by La Niña. Fortunately, analyses have shown that, over the long run, La Niña events tend to operate at the advantage of grain productivity in China. Moreover, The United States, which are the second largest soybean producers, could also increase the supply to balance the uncertainty ruling over Latin American countries. 

Of course, increasing production requires a certain level of technological advance. It also requires a larger number of producers, which is why this process would require investments and government subsidies.

SUBSTITUTES

The primary uses of soybeans are food, biofuel and flour. 

Soybeans are used for feed because they have a high concentration of proteins with ~48%. One of the substitutes for this use could be corn even though it has a much lower concentration of proteins with ~9%. Moreover, corn is cheaper than soybean. For a bushel of soybeans it costs US$ 12.64, which is three times the price of corn, US$ 4.51. Furthermore, instead of using soy flour, it can be replaced by wheat flour. 

In order to replace the biofuel made by soybean, they can instead use crude palm oil but it is more expensive than soybean and has major negative effects on the environment like deforestation. 

We can find some substitutes to soybean but none of them has better elements than this commodity.

RECOMMENDATION

Prices will continue to increase due to the high demand and slow supply. Moreover, the supply is uncertain since there are weather issues in Latin America. Another point we have to take into account is the tariffs between US and China with the election of Joe Biden who said that it was a failure and wants to do a full review of the agreements. 

For all of these reasons, we recommend going long over the next month since the supply is uncertain but also low. 

REFERENCES

China’s November soybean imports from U.S. surge one year after trade deal, 2020. Successful Farming [online]. [Viewed 29 December 2020]. Available from: https://www.agriculture.com/markets/newswire/update-1-chinas-nov-soybean-imports-from-us-surge-on-year-after-trade-deal

Commodities 2021: US soybean prices likely to rise on high exports, tight stocks | S&P Global Platts, 2020. [online]. [Viewed 29 December 2020]. Available from: https://www.spglobal.com/platts/en/market-insights/latest-news/agriculture/122220-commodities-2021-us-soybean-prices-likely-to-rise-on-high-exports-tight-stocks

CONSTABLE, Simon, [no date]. Bad Weather Could Hurt Soybean Crops, Lifting Prices. [online]. [Viewed 29 December 2020]. Available from: https://www.barrons.com/articles/bad-weather-could-hurt-soybean-crops-that-will-help-lift-prices-51608676202

Corn Prices – 59 Year Historical Chart, [no date]. [online]. [Viewed 29 December 2020]. Available from: https://www.macrotrends.net/2532/corn-prices-historical-chart-data

Explosive soybean price picture forming, analyst says, 2020. Successful Farming [online]. [Viewed 29 December 2020]. Available from: https://www.agriculture.com/markets/analysis/explosive-soybean-price-picture-forming-analyst-says

Palm oil and soy oil for biofuels linked to high rates of deforestation – new study | Transport & Environment, [no date]. [online]. [Viewed 29 December 2020]. Available from: https://www.transportenvironment.org/press/palm-oil-and-soy-oil-biofuels-linked-high-rates-deforestation-new-study

snd_cbt.pdf, [no date]. [online]. [Viewed 29 December 2020]. Available from: https://www.cmegroup.com/trading/agricultural/files/ht_charts/snd_cbt.pdf

Soybean Prices – 45 Year Historical Chart, [no date]. [online]. [Viewed 29 December 2020]. Available from: https://www.macrotrends.net/2531/soybean-prices-historical-chart-data

Soybeans | 1977-2020 Data | 2021-2022 Forecast | Price | Quote | Chart | Historical, [no date]. [online]. [Viewed 29 December 2020]. Available from: https://tradingeconomics.com/commodity/soybeans

Brazilian soybean planting slowest in a decade despite rains: AgRural | S&P Global Platts, 2020. [online]. [Viewed 29 December 2020]. Available from: https://www.spglobal.com/platts/en/market-insights/latest-news/agriculture/101920-brazilian-soybean-planting-slowest-in-a-decade-despite-rains-agrural

Geosys How is La Niña impacting Brazilian and Argentina crops?, 2020. UrtheCast [online]. [Viewed 29 December 2020]. Available from: https://www.urthecast.com/how-is-la-nina-impacting-brazilian-and-argentina-crops/

LEMONICK, Michael D., [no date]. Global Warming May Worsen Effects of El Niño, La Niña Events. [online]. [Viewed 29 December 2020]. Available from: https://www.climatecentral.org/news/is-texas-toast

LI, Yanyun, STRAPASSON, Alexandre and ROJAS, Oscar, 2020. Assessment of El Niño and La Niña impacts on China: Enhancing the Early Warning System on Food and Agriculture. Weather and Climate Extremes. 1 March 2020. Vol. 27, p. 100208. DOI 10.1016/j.wace.2019.100208.

Group 3 – K
Maxime DOLLA, Mahona PENNA, Romane POUCHON

Battery Material Bulletin n°3

Nickel in batteries

There are two classifications of batteries: primary batteries which are disposable meaning for single-use and secondary batteries which can be recharged and reused. Nickel is an essential component for the cathodes of many secondary battery designs, including lithium-ion (Li-ion) batteries that power much of the electric vehicle revolution.

https://nickelinstitute.org/media/2318/nickel_battery_infographic-finalen2.pdf

Using nickel in car batteries offers greater energy density and storage at a lower cost, delivering a longer range for vehicles, currently one of the restraints to electrical vehicle uptake.

Further advances in nickel-containing battery technology mean it is set for an increasing role in energy storage systems, helping make the cost of each kWh of battery storage more competitive. It is making energy production from intermittent renewable energy sources such as wind and solar replace fossil fuels more viable. The challenge is that the wind doesn’t blow, and the sun doesn’t shine on demand. This is why batteries are being deployed to capture energy and release it when required, helping stabilize the complex and widespread electricity infrastructure.

https://nickelinstitute.org/media/2318/nickel_battery_infographic-finalen2.pdf

The demand for nickel comes predominantly from the stainless-steel industry. Only 5 to 8 percent of the demand for nickel comes from batteries. However, the type of nickel separates the market. Indeed, to make stainless steel both Class 1 and Class 2 nickel can be used. For the battery industry, on the other hand, the type of nickel used is extremely important. It defines the quality and performance of the batteries. The battery industry can only use Class 1 nickel.

https://www.mckinsey.com/industries/metals-and-mining/our-insights/how-clean-can-the-nickel-industry-become

At best only 46 percent of the world’s nickel (Class 1) production can be used in batteries.

https://www.mckinsey.com/industries/metals-and-mining/our-insights/how-clean-can-the-nickel-industry-become

According to McKinsey, the global demand for Class 1 nickel could skyrocket. They expect the demand to increase from 2.2 million metric tons to 3.5 to 4 million metric tons by 2030.

https://www.mckinsey.com/industries/metals-and-mining/our-insights/how-clean-can-the-nickel-industry-become

A scarcity of sulfide deposits is contributing to a looming shortage of Class 1 nickel.

The current challenge is then to nearly double the supply of Class 1 nickel while meeting environmental, social, and corporate governance requirements. Indeed, the industry received a clear signal when Tesla’s Elon Musk stated that he would award a “giant contract for a long period of time if you mine nickel efficiently and in an environmentally sensitive way”.

https://www.mckinsey.com/industries/metals-and-mining/our-insights/how-clean-can-the-nickel-industry-become

Cobalt

Supply and demand outlook for Europe: From mining to recycling, is it going to be sufficient to counter the growing demand in batteries?

The EU has launched several project for mining exploration in order to depend less on the CHINA-DRC supply chain. In the long term, Cobalt is bound to become a fundamental resource as the EVs and electronical device market are growing every year (The number of EVs is expected to reach 250mio by 2030 compared to 8mio in 2019). Quick reminder: DRC stands for about 55% of the global raw Cobalt supply and China stands at an astonishing 80% of refined Cobalt supply. We had also seen that 8 out of the 14 main cobalt refineries are based in China.

https://www.iea.org/reports/global-ev-outlook-2020

We had seen in the previous bulletin that Canada, other than being one of the biggest Cobalt producers had built the very first North American Cobalt refinery for export and is doing mining exploration over the country in order to find new resources of Cobalt[1] and to disrupt the CHINA-DRC monopoly over the supply chain.


Image source from: https://www.visualcapitalist.com/ethical-supply-the-search-for-cobalt-beyond-the-congo/

What about the EU?

If we look at the map above, we can see that the EU has refineries but not a lot of production. Its few mining areas are situated in Finland. Here is a map of the mining places and the projects put in place by the EU in order to counter the future shortage of the commodity.

https://publications.jrc.ec.europa.eu/repository/bitstream/JRC112285/jrc112285_cobalt.pdf

(Between exploration and actual start of operation, a time frame of 10 years can occur)

The EU cobalt demand is increasing over time and we can clearly see that it cannot supply itself currently making it highly dependent on the other suppliers.

While waiting for the cobalt mining discoveries, the EU is trying to concentrate its effort in battery recycling. Right now, there is not enough old battery supply to make it really viable, but looking at the forecast of the EV market, recycling will definitely become an important source of cobalt supply. The estimate rate of used battery collection is 90%.

https://publications.jrc.ec.europa.eu/repository/bitstream/JRC112285/jrc112285_cobalt.pdf

The estimations in the table assume an average lifetime of 8 years for each vehicle battery placed on the market. The potential amounts of recycled cobalt generated from old vehicles deployed in the EU are estimated at 500 tonnes in 2025 and may amount, on average, to 5 500 tonnes in 2030. This would mean that in 2030, the recycling could provide for about 10 % of European cobalt consumption in the EVs sector (see graph figure 36 above).

World cobalt demand may be subject to a growth rate of between 7 % and 13 % depending on the cobalt forecast usage for different areas (EVs, alloy, etc.). Between 2017 and 2030, the average cobalt consumption will amount at about 220 000 tonnes in 2025 and 390 000 tonnes in 2030. In the EU, cobalt demand will amount to 53 500 tonnes in 2025 and increasing to 108 000 tonnes in 2030.

Global

https://publications.jrc.ec.europa.eu/repository/bitstream/JRC112285/jrc112285_cobalt.pdf

Global

https://publications.jrc.ec.europa.eu/repository/bitstream/JRC112285/jrc112285_cobalt.pdf

The report forecast a cobalt shortage in 5 years’ time. We can foresee an increase in the price of the Cobalt worldwide and mostly in the EU. Commodity companies such as Glencore (no1 in Cobalt mining) knowing this will surely profit to put higher margins as the product will become scarce.

Sources:

https://www.mckinsey.com/industries/metals-and-mining/our-insights/how-clean-can-the-nickel-industry-become#

https://nickelinstitute.org/about-nickel/nickel-in-batteries/#:~:text=Nickel%20is%20making%20a%20vital,of%20the%20electric%20vehicle%20revolution.&text=The%20major%20advantage%20of%20using,capacity%20at%20a%20lower%20cost

https://www.mining.com/chart-chinas-stranglehold-on-electric-car-battery-supply-chain/

https://campus.hesge.ch/commodity-trading/?p=1271

https://publications.jrc.ec.europa.eu/repository/bitstream/JRC112285/jrc112285_cobalt.pdf

https://publications.jrc.ec.europa.eu/repository/bitstream/JRC112285/jrc112285_cobalt.pdf

https://publications.jrc.ec.europa.eu/repository/bitstream/JRC112285/jrc112285_cobalt.pdf