Bulletin#3 – The largest exporter of wheat reducing exportation

By Lyticia Wouguia, Christopher Delfin, Piratharsan Poologanathan

Russia imposes export tax and quota 

Russia, one of the world’s largest wheat exporters, recently issued a list of orders aimed at stabilising domestic food prices, including a grain export quota and wheat export tax. These new measures will start from 15th February 2021 until 30th June 2021. The government introduced a quota for overseas shipments of wheat, rye, barley and corn limiting exports to 17.5 million tonnes. In addition, along with that quota, they also implemented a wheat export tax of 25 euros or 30.40 US dollars per tonne. Furthermore, if export volumes are higher than the quota, the tax for wheat would rise to 50% of the customs price or 100 euros per tonne, whichever is higher.

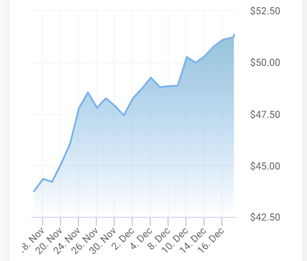
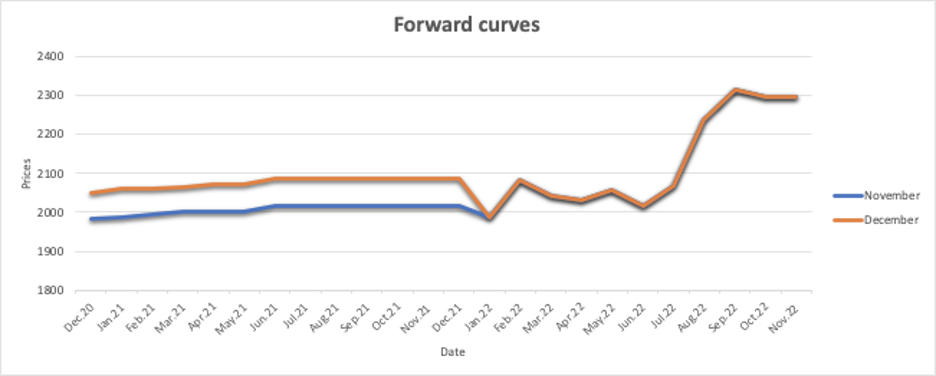
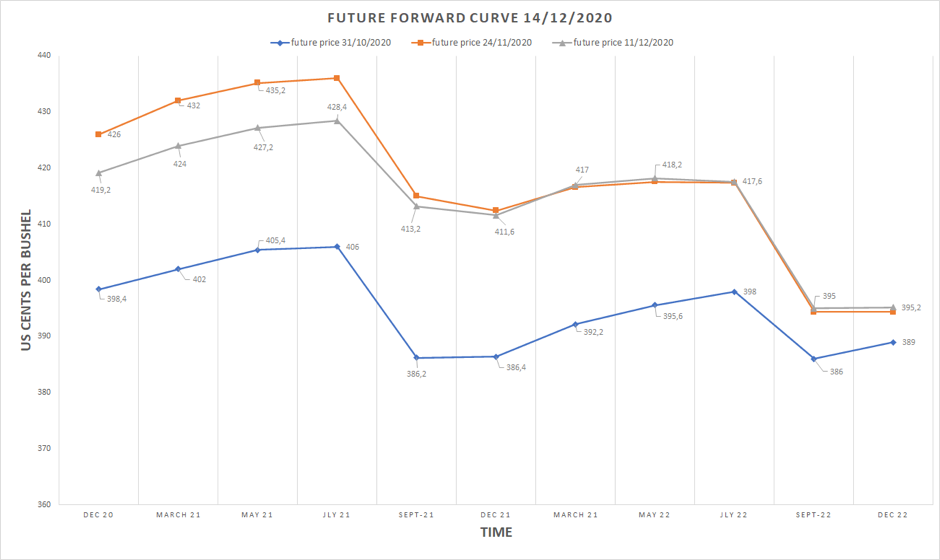
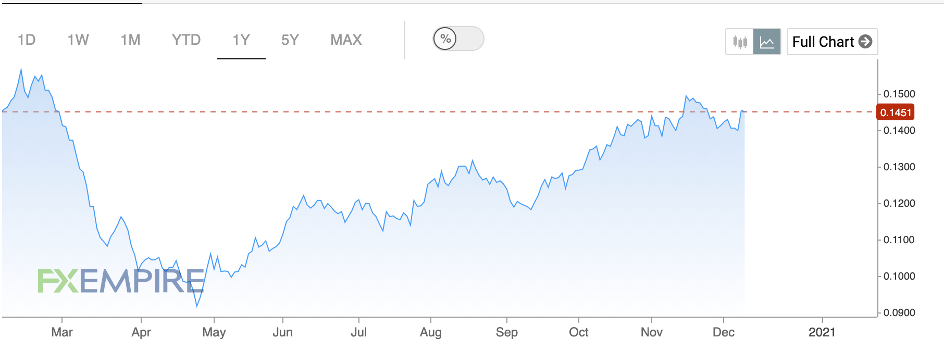
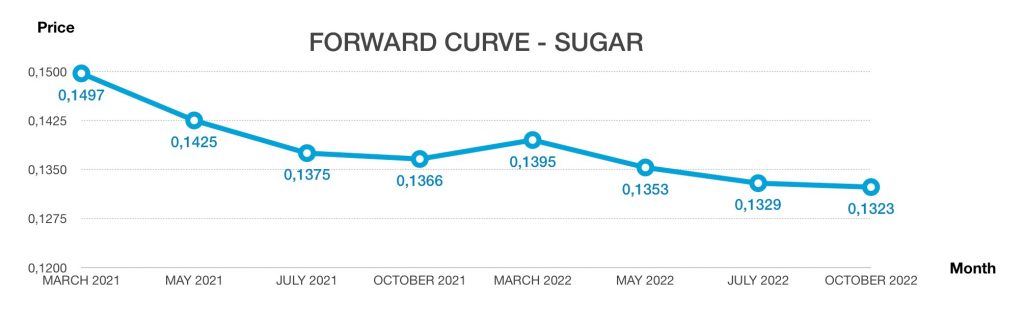
The figure below are the futures prices in the black sea wheat market. There is a steady increase in the beginning of the year until May, which makes the market in a normal curve. The reason behind the increase is partially due to the new measures which were mentioned in the previous paragraph. As the regulation is from Feb-June, the tax could reduce Russia’s wheat export which makes the futures prices higher in those months. Another reason for high prices is due to low wheat production caused by prolonged dry weather and a strong demand from global buyers. The bad weather condition has disrupted and delayed planting of the major wheat producing and exporting countries.

Black sea wheat futures 

From: barchart

Turkey grains import tax cut likely to be extended 

The Turkish government decided to suspend tariffs on wheat, maize and barley at the end of October in order to support its domestic milling market against a backdrop of rising international prices and concerns about local food security. The suspension is expected to end in early calendar year 2021. But as the Covid-19 pandemic continues to threaten domestic supplies, it seems likely that import tariffs will remain lifted at least until the end of the current crop year, on 30 June 2021.

The extension of the tax reduction until next year would allow importers more time to reap the benefits of this measure, as the Turkish lira depreciates in value – caused by inflation and concerns about the Covid-19 recession. Indeed, Covid-19 has increased the costs of international wheat supply for Turkish buyers in recent weeks.

https://www.cmegroup.com/trading/agricultural/wheat-reports.html

Demand

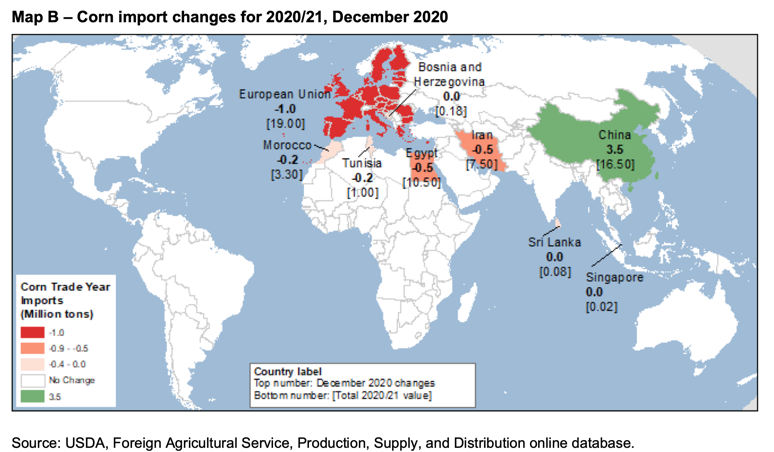
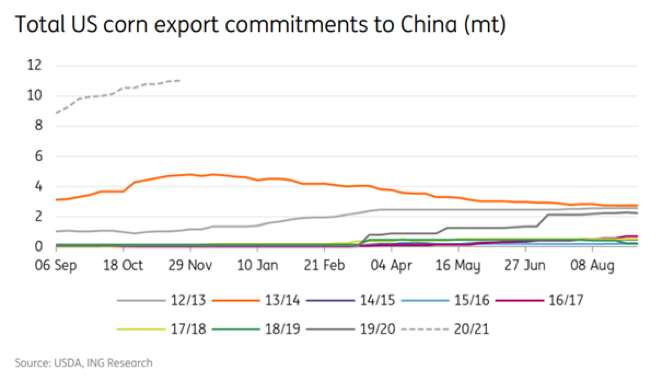
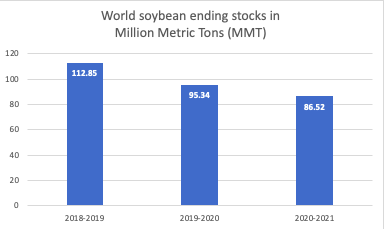
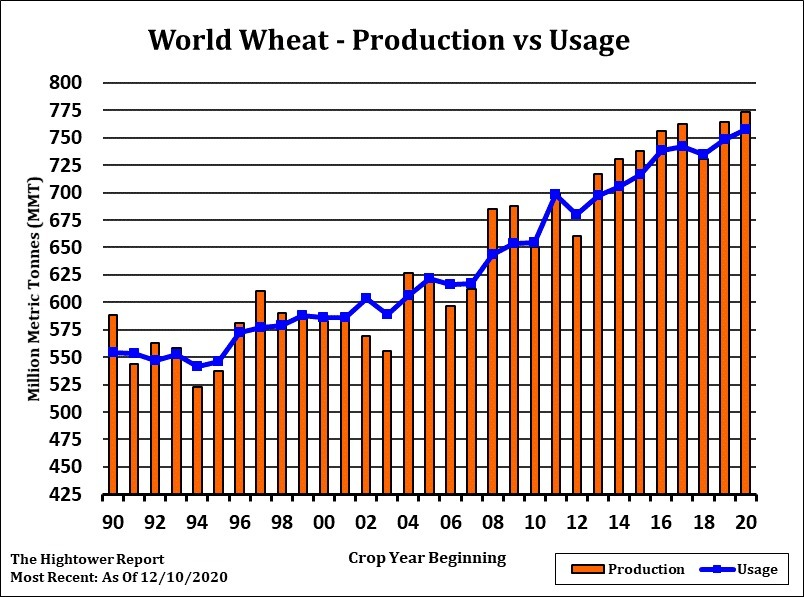
The global demand is increasing due to several reasons. The main importer’s countries are increasing the amount of wheat entering their land. The global consumption has reached 757.8 million for 2020 and 2021. Even though the production has increased by 1.2 million to reach the record global production at 773.7 million. It is not enough to reach the demand of certain countries. Indeed, China, for example, has increased their demand. It is mainly explained by the need to feed livestock. China is not the only one to increase, Pakistan as well has raised the import. Furthermore, the world ending stock is expected to lower for 2020/21. 

Supply

Due to the increasing demand, the supply is looking for larger producers. As explained in the previous bulletin, the australian production is expected to increase. Russia’a production has also increased. Nevertheless, in order to protect the local farmer from raising prices, they will impose a tax on export in the near future. Canada’s wheat production has a slight increase in their production. 

Recommendation

Due to the new measures, this has triggered volatility in global wheat prices. A trader should look for different markets in order to make profit and avoid the uncertainties. It is also important to check for trends in the industry and futures markets as demand keeps on increasing. In our opinion, it is better to lock in prices today before the regulations come into effect in mid-February.

Sources: 

https://www.thefinancialexpress.com.bd/trade/russia-imposes-wheat-export-tax-other-steps-to-stabilise-food-prices-1608126112

https://www.barchart.com/futures/quotes/KF*0

https://www.argusmedia.com/en/news/2157551-turkey-grains-import-tax-cut-likely-to-be-extended

http://dtn.agfax.com/index.cfm?show=62&subtype=5

https://www.usda.gov/oce/commodity/wasde/wasde1220.pdf

https://www.cmegroup.com/trading/agricultural/wheat-reports.html

Hope for a vaccine, and OPEC+ new terms impact on Russian Crude. Weekly bulletin #3

Price mouvement

At the OPEC+ meeting on 30 November, it was decided to increase production by 500,000bp each month from January if the situation allows it at their next meeting in early January. The hope of a positive vaccine has a beneficial effect on the continuing rise in the benchmark prices.

On the oil market, the demand from Asia remains strong but prices are constrained by low refinery margins, increased production and still high stocks. Uncertainties regarding oil demand remain high. Forecasts expecting a decrease by the end of the year followed by an increase in the course of 2021.

Brent crude – Decembre Contracts.
Source: https://oilprice.com/oil-price-charts/block/1

Differentials

Since the end of November, the differential in price between Brent (light sweet) and Urals (medium sour) has returned to a discount because supply is stronger than demand.

Forward curves

The sustained recovery of the Libyan supply, the weak demand from European refiners and the context of mobility restrictions maintained the contango of November. Then the strong demand from Asia, which reduced unsold volumes and the optimism of a vaccine enabled the contango to be flattened, ending up on backwardation for the December forecasts.

OPEC Monthly oil market Report
Source:https://www.opec.org/opec_web/en/publications/338.htm

Demand and supply key drivers

What will be driving the market for the next weeks is the evolution of the new OPEC+ agreements, that were established the 3rd of December, they decided to gradually increase production from January, and meet monthly afterward. Russian production was around 10 million barrels per day in November, which was at a low compared to the previous year, mostly due to the cuts. Production will still be reduced to 8.99 million B/D in December, followed by a gradual increase of 500,000 B/D starting January. Demand is indeed expected to rise, but that remains to be seen, as it heavily relies on the pandemic evolution, and the vaccine efficiency, whose fast approval and testing created a price rally. Nevertheless, analyst have lowered their forecast for 2021.

Source: https://www.opec.org/opec_web/en/publications/338.htm

Russia has recently signalled it is bracing for a drastic decline in oil demand, as they think consumption peaked already and that the long term is subject to high risk. This situation might well totally change how Russia will operate, as they intend to switch to greener energy, such as hydrogen. As a matter of fact, companies, such as Gazprom, intend to be producing the clean energy in four years. Russia has already made a roadmap of how they intend to swap from oil to hydrogen, and this will surely change the soviet’s economy drastically.

However, there are some good news, as 50% of the easing in the OPEC+ cuts will benefit Russia and Saudi Arabia, meaning they will be able to produce more, though this also means demand will be affected, and recover more slowly in Q1 of 2021.

Source: https://www.eia.gov/outlooks/steo/report/global_oil.php

Finally, the second lockdown keeps on influencing demand, and this will continue as the World is going through societal shifts concerning travels. Gasoline and diesel demand being at 90% of their usual levels and jet fuel only at 50% are indicators of this situation. This being said, Asia, who favours Russian crude such as ESPO, has been less affected by the second lockdown and is a key player regarding the demand, with countries like China still importing big quantities of crude oil.

As for stock levels, they are as planned difficult to come by for Russia. However, a global overview show how they rose during those last months in the world.

Recommandations:

On the short term, we recommend to have a long postition as the current measures taken by the OPEC+ organisation are working. However, on the medium to long run, we advise to remain cautious and see how the easing in the production cuts will affect the market, as well as the pandemic evolution with the new vaccines. It is also important to verify if the backwardation will remain before taking any decisions.

Sources:

Oil price charts. Consulté le 14 décembre
https://oilprice.com/oil-price-charts/block/1

Brent crude oil review. Consulté le 15 décembre
https://www.cmegroup.com/trading/energy/crude-oil/brent-crude-oil.html

Urals Brent price differences. Consulté le 16 décembre.
https://www.neste.com/investors/market-data/urals-brent-price-difference

Monthly oil market review. Consulté le 16 décembre
https://www.opec.org/opec_web/en/publications/338.htm

“OPEC – Monthly Oil Market Report” Consulté le 16 Décembre
https://www.opec.org/opec_web/en/publications/338.htm

“Russian Energy Minister Sees 2 Million Bpd OPEC+ Output Increase In April” Consulté le 16 Décembre
https://oilprice.com/Energy/Energy-General/Russian-Energy-Minister-Sees-2-Million-Bpd-OPEC-Output-Increase-In-April.html

“Oil prices rise on vaccine hopes, ship explosion at Saudi Arabia” Consulté le 16 Dévembre
https://energy.economictimes.indiatimes.com/news/oil-and-gas/oil-prices-rise-on-vaccine-hopes-ship-explosion-at-saudi-arabia/79717728

“Russia’s Nov oil output steady on month at 10 mil b/d”. Consulté le 13 Décembre
https://www.spglobal.com/platts/en/market-insights/latest-news/oil/120220-russias-nov-oil-output-steady-on-month-at-10-mil-bd

“Russia braces for permanent decline in oil demand”. Consulté le 13 Décembre
https://oilprice.com/Energy/Crude-Oil/Russia-Braces-For-Permanent-Decline-In-Oil-Demand.html

“The OPEC Mission to balance oil markets is just getting started”. Consulté le 14 Décembre
https://oilprice.com/Energy/Energy-General/The-OPEC-Mission-To-Balance-Oil-Markets-Is-Just-Getting-Started.html

China impacting the world

Price movement recap

Source: London Metal Exchange

Prices on LME are still above what they were before the COVID-19 lockdown in March 2020 but remain lower than on SHFE. China’s demand is very strong and has consequently seen domestic prices increase. Not forgetting the government injecting money to re-boost the economy, especially in the infrastructure sector.

This price increase has led to a boost in output, which was 3.18 million tonnes in November, an increase of almost 9% compared to November 2019. The current price is encouraging smelters in China.

In addition, there is a Chinese need for automobile production which has also led to an increase in aluminium price.

Forward curve

Source: CME Group

The price has increased compared to the previous month for the same delivery period.

For the following year, the curve is almost flat in a small contango, demonstrating an uncertainty that the curve can shift at any time. As it does not increase substantially we could argue that it may not cover the costs of financing and storage for delivery in the upcoming months.

Supply and demand dynamic 

From the supply side, an increased focus is given to the can’s recycling sector meaning secondary aluminium is expected to take more and more space in supply. Robert Budway, president of Can Manufacturers Institute said that: “More than 90 percent of these recycled cans get turned into aluminium sheets used to make new beverage cans. These used cans plus other scrap metal create an average recycled content rate of 73 percent, which is exponentially higher than any competing substrate.” In parallel, more and more companies such as UC Rusal, Russian Federation major aluminium company, are focusing on making their smelter more sustainable by obtaining certifications by the Aluminium Stewardship Initiative.

Inventory levels

Source: London Metal Exchange

The stock level of LME is still decreasing. China representing 55% of the global output has seen its production increase since April 2020 as its economy returns to normality after the COVID-19. Besides, China which was a net exporter is now a net importer of primary aluminium due to the increase of its own demand and a decrease of exports as the rest of the world struggles to recover from the global pandemic. The inventory on the Shanghai Metal Exchange keeps decreasing showing how tight the China aluminium market is and impacting directly the London Metal Exchange. Moreover, importation of aluminium became much more profitable in China, and as the demand in the country is high, companies tend to import more.

For a country producing a majority of the world’s supply, we would not expect them to become a net importer. One reason is a fluctuation for the US dollar, as the Chinese yuan became stronger against the dollar as well as the tight Chinese inventory.

Recommendations

As the contango is relatively flat, we cannot guarantee that storing and financing costs will be covered. Trading behaviour will be influenced by the forward curve, here the contango does not have an important slope, so it may not be worth it to store the goods.

Beatriz Ferreira Caetano, Virginie Gruaz and Mingxin Ma


References

Aluminum Futures Quotes – CME Group, [no date]. [online]. [Viewed 17 December 2020]. Available from: https://www.cmegroup.com/trading/metals/base/aluminum_quotes_globex.html

CHINA AUTO: Vehicle output growth bolsters raw material prices in November | Metal Bulletin.com, [no date]. [online]. [Viewed 17 December 2020]. Available from: https://www.metalbulletin.com/Article/3966588/Aluminium/CHINA-AUTO-Vehicle-output-growth-bolsters-raw-material-prices-in-November.html

Five More Rusal Facilities Certified By Aluminium Stewardship Initiative, 2020. Aluminium Insider[online]. [Viewed 17 December 2020]. Available from: https://aluminiuminsider.com/five-more-rusal-facilities-certified-by-aluminium-stewardship-initiative/

HORNER, Will, 2020. Aluminum Prices Surge as Chinese Demand Accelerates. Wall Street Journal[online]. 20 October 2020. [Viewed 17 December 2020]. Available from: https://www.wsj.com/articles/aluminum-prices-surge-as-chinese-demand-accelerates-11603200739

London Metal Exchange: LME Aluminium, [no date]. [online]. [Viewed 17 December 2020]. Available from: https://www.lme.com/en-GB/Metals/Non-ferrous/Aluminium#tabIndex=2

London Metal Exchange: Stocks summary, [no date]. [online]. [Viewed 17 December 2020]. Available from: https://www.lme.com/Market-Data/Reports-and-data/Warehouse-and-stocks-reports/Stocks-summary

MARKETSCREENER, [no date]. China Nov aluminium output hits daily record high | MarketScreener. [online]. [Viewed 17 December 2020]. Available from: https://www.marketscreener.com/quote/commodity/LME-ALUMINIUM-CASH-16159/news/China-Nov-aluminium-output-hits-daily-record-high-32011792/

Metal stocks to gain from China’s rising demand, 2020. The Malaysian Reserve [online]. [Viewed 17 December 2020]. Available from: https://themalaysianreserve.com/2020/12/14/metal-stocks-to-gain-from-chinas-rising-demand/

Shanghai-bonded aluminium stocks plunge in Nov on open arb; zinc shows biggest increase | Metal Bulletin.com, [no date]. [online]. [Viewed 17 December 2020]. Available from: https://www.metalbulletin.com/Article/3964495/Aluminium/Shanghai-bonded-aluminium-stocks-plunge-in-Nov-on-open-arb-zinc-shows-biggest-increase.html

STAFF, 2020. Aluminum Association Report Emphasizes Aluminium Beverage Can’s Importance To Sustainability. Aluminium Insider [online]. 6 December 2020. [Viewed 17 December 2020]. Available from: https://aluminiuminsider.com/aluminum-association-report-emphasizes-aluminium-beverage-cans-importance-to-sustainability/

BULLETIN N°3 – INCREASED GLOBAL CORN TRADE,DRIVEN BY STRONG DEMAND FOR FEED IN CHINA

Source : bloomberg

PRICE

The strong demand from China has resulted in higher maize price over the past several months.

PRODUCTION

World maize production for 2020/2021 is forecast to a total of 1,143.6 million MT, down 1.1 million MT from the November forecast.

Argentina is suffering the consequences and the drought of “La Niña”. In fact, the area devoted to corn is expected to decrease by 2% compared to last month, from 50 million tons to 49 million tons. This is accounting for the largest decrease in production this month. The corn production in the EU has decreased by 0.5 million MT to 63.7 million MT because they experienced dry conditions during important parts of the crop development cycle in particular, in Bulgaria.

In the past Bulletin we saw that the corn production in Ukraine (4th largest exporter) for 2020/2021 has suffered from a severe drought which badly affected the production. This month corn production for 2020/21 has increased by 1.0 million MT from the previous month, compensating for some of the global declines. But the gap is still huge compared to last year -14%. 

DEMAND

Despite the expected slowdown in feed usage due to COVID-19, several countries imported record volumes of corn in 2020. Corn imports are expected to increase in 2021 of 7% from last year’s record. This increase is largely due to China. China has been engaged since mid-year in securing corn and some substitutes (sorghum and barley) to meet the increasing demand for feed in the livestock sector.According to USDA International Agriculture Services, China’s corn imports are expected to triple to 22 million tons this season.

Total imports of maize from China increased by 3.5 million MT to 16.5 million this month. The main explanation for China’s increased demand for corn for animal feed is that pigs’ herds in China are beginning to recover from the African swine fever. One of their key resources are pigs, so the government has made the increasing of pork’s production in the country a high priority.

Globally, China’s increased imports of maize are offset in part by lower imports from several other major import markets.

Corn imports are subject to the tariff quota set by the World Trade Organization on a calendar year basis, but imports are already above the quota of 7.2 million tons only with the January-October period. 

There is a trade war between the two big players but if we take a closer look, the relationship between the U.S. and China was never better, and the quantity of imports/exports of corn was never as considerable as it is now. Corn has risen to nearly 30% of US export sales.

China has submitted a draft law to ensure national food security and to reform the management of the key grain reserves in China. This project also includes the United States. Indeed, Trump had made an agreement with China for “phase 1”, which includes commitment purchases by China of agricultural products in 2020-2021.

ENDING STOCK

As we explain above the demand is superior to the supply side. The overall decrease for corn production and the growing demand from China lead to an urgent need for the ending stock. The production was estimated lower than the last month we lost almost 1million tons mainly caused by Argentina. Even if the South American countries did not suffer from the climate, the other producer countries (North hemisphere), registered a lower production and the harvest period is almost over now. The consumption is estimated to increase for 1.5 millions tons this month compared to November, largely sustained by China. The consumption in a month has increased to 2.5 millions tons. With a basic calculation we found that the demand exceeds the supply side to 14.5millions tons and that is why we assist to a decrease in ending stock. From November the ending stock lost almost 2.5 millions tons. All these factors explain the positive fluctuation for corn price.

FORWARD CURVE

The shape of the forward curve for our three bulletins are almost identical due to seasonality. It is a normal curve (it is well supplied) from december to july (the message is to store) and goes into an inverse curve (the demand is hot) from july to december (the message is to deliver)

The prices agreed on the 11th of December are lower than the price agreed on the 24th of November for the seven upcoming contracts. 

It is odd because supply decreases this month and demand increases which would normally result in higher price for the spot and future. We think that it is because the supply has decreased a lot because of Ukraine and the demand increased because of China resulting in higher prices agreed on the 24th November. And for the price agreed on the 11th of December, the supply of Ukraine increased from last month. It can also be hypothesized that the market overreacted last month. One of the reasons for this strong reaction is that the gap between production and demand between October and November tripled from almost -4 million tons (=lack of supply) to -12 million tons (+300% increase). Whereas this month we went from -12 to -14.5 million tons (20.8%).

RECOMMENDATION

As mentioned above, supply decreased this month and there is an increase in the demand from China. The gap between supply and demand has increased by 2.5Millions tons since last month. Therefore we assume that the spot price will increase too. We are still on a normal curve this month. Furthermore, the news of COVID-19 vaccine and the end of the lockdown in some countries will reassure the economics agents. Our recommendation from a trader point of view is to buy physically in the spot market, and sell futures on a later date if the slope is sufficient to overlap the storing and financing costs. The trader will make profit thanks to his benefit from the physical result and paper result. 

Léo Millet, Maike Da Silva, Patrice Correia Cardoso & Cassandra Kirchhoff

SOURCE

cmd-strong-chinese-agri-purchases-likely-to-continue-in-2021.pdf, [sans date]. [en ligne]. [Consulté le 17 décembre 2020]. Disponible à l’adresse : https://think.ing.com/downloads/pdf/article/cmd-strong-chinese-agri-purchases-likely-to-continue-in-2021

Corn | USDA Foreign Agricultural Service, [sans date]. [en ligne]. [Consulté le 17 décembre 2020]. Disponible à l’adresse : https://www.fas.usda.gov/commodities/corn

Corn Futures Settlements – CME Group, [sans date]. [en ligne]. [Consulté le 17 décembre 2020]. Disponible à l’adresse : https://www.cmegroup.com/content/cmegroup/en/trading/agricultural/grain-and-oilseed/corn_quotes_settlements_futures.html

grain__1_.pdf, [sans date]. [en ligne]. [Consulté le 17 décembre 2020]. Disponible à l’adresse :https://downloads.usda.library.cornell.edu/usda-esmis/files/zs25x844t/5425m323c/ns064z89z/grain__1_.pdf

grain.pdf, [sans date]. [en ligne]. [Consulté le 17 décembre 2020 a]. Disponible à l’adresse :https://apps.fas.usda.gov/psdonline/circulars/grain.pdf

grain.pdf, [sans date]. [en ligne]. [Consulté le 17 décembre 2020 b]. Disponible à l’adresse :https://downloads.usda.library.cornell.edu/usda-esmis/files/zs25x844t/7h14bd24q/gq67kf77r/grain.pdf

grain.pdf, [sans date]. [en ligne]. [Consulté le 17 décembre 2020 c]. Disponible à l’adresse :https://downloads.usda.library.cornell.edu/usda-esmis/files/zs25x844t/6w925260x/8049gw97t/grain.pdf

International Grains Council, [sans date]. [en ligne]. [Consulté le 17 décembre 2020]. Disponible à l’adresse :https://www.igc.int/en/markets/marketinfo-sd.aspx

Latest News | S&P Global Platts, [sans date]. [en ligne]. [Consulté le 17 décembre 2020]. Disponible à l’adresse : https://www.spglobal.com/platts/en/market-insights/latest-news

McConnell et Olson – 2020 – No Changes to the 202021 U.S. Corn Market Outlook.pdf, [sans date]. [en ligne]. [Consulté le 17 décembre 2020]. Disponible à l’adresse :https://www.ers.usda.gov/webdocs/outlooks/100046/fds-20l.pdf?v=5690.1

production.pdf, [sans date]. [en ligne]. [Consulté le 17 décembre 2020]. Disponible à l’adresse :https://apps.fas.usda.gov/psdonline/circulars/production.pdf

snd_cbt.pdf, [sans date]. [en ligne]. [Consulté le 17 décembre 2020]. Disponible à l’adresse :https://www.cmegroup.com/trading/agricultural/files/ht_charts/snd_cbt.pdf

wasde1220.pdf, [sans date]. [en ligne]. [Consulté le 17 décembre 2020]. Disponible à l’adresse :https://www.usda.gov/oce/commodity/wasde/wasde1220.pdf

Sugar 3rd Bulletin – Forecast

As usual we will do a small recap on the price of sugar. The first bulletin showed a price of 0.1379$ and the second one 0.1483$. Sugar today’s price reached 0.1451$. As we can see, price level tends to recover the prices before the pandemic.

Sugar price in USD/pound

Source: https://www.fxempire.com/commodities/sugar

World sugar prices:

As we can see in the graph below, sugar prices decreased in the recent years. In term of nominal price we can see that the prices are forecasting to increase. If we assume that weather will be normal, we can expect that India and Thailand crop will come back to their level as previous years.

In term of real sugar prices, we can see that it would remain at the level of 2019. This could be explained by the competitiveness of ethanol which is made from sugar.

World sugar crops production in the long term :

Here we can see a comparative and forecast between sugarcane and sugar beet in India, Brazil and the rest of the world.

That is interesting to see that biofuel such as ethanol represents more than the half of the total production in Brazil, whereas in India there is no ethanol production. Moreover, we can see that the production forecast for 2029 tends to increase. Indeed, Brazil will remain the main producer in ethanol. As we have seen in the last bulletin, India is impacted by public sector, that is why we can explain the small increase in the production on contrary to Brazil.

In addition to the graph above, this graph below shows the increase in the production of sugar. Especially in developing countries such as India and Thailand, because of the increase in demand.

Just to say something about the export, something changes in the currency. The real the 7th of December rose +0.99% against the dollar, which discourages export selling by Brazil’s sugar producers.

We can also look back at what is currently happening in India in terms of exports (in relation to the uncertainties related to subsidies). Thus, since Bulletin #2, Indian sugar mills have held back exports as they await news on government subsidies (still no news). The World Trade Organization (WTO) is expected to rule on the legality of India’s subsidies to its sugar exporters by the end of 2020.

Sugar demand in the long term :

The demand in sugar is expecting to grow and to come mainly from the developing countries. As we noticed, Asia and Africa will be the main contributor to the increase in demand of sugar (figure 5.5). Indeed, in figure 5.8 we can see that in Indonesia and China the sugar imports are expecting to grow substantially. In contrary, developed countries will decrease their demand, due to health concerns. But also due to taxes on caloric sugary products like in Mexico, that is why we can explain the drastic decrease in demand. The overall extent of the global recovery in sugar consumption will depend on how the COVID-19 pandemic develops in the coming months, and particularly on whether or not further lockdown measures would be imposed.

As we can see in the graph below we have a backwardation until October 2021 then a contango until March 2021 and finally a backwardation until October 2022.

 Sugar price in USD/pound

Recommendation :

As we can expect a backwardation we recommend to go long. But still we are in an uncertain time due to COVID-19 but also weather it means that prices need to be monitored, in order to be protected against eventual inverse price movements. Furthermore, the situation in India due to the public sector tends to remain uncertain.

References :

Sugar Price | FX Empire, [no date]. [online]. [Viewed 7 December 2020]. Available from: https://www.fxempire.com/commodities/sugar

No. 11 Sugar Futures Quotes – CME Group, [no date]. [online]. [Viewed 9 December 2020]. Available from: https://www.cmegroup.com/trading/agricultural/softs/sugar-no11.html


sugar_assessment_food_outlook_may_2019.pdf, [no date]. [online]. [Viewed 8 December 2020]. Available from: http://www.fao.org/fileadmin/templates/est/COMM_MARKETS_MONITORING/Sugar/Documents/sugar_assessment_food_outlook_may_2019.pdf

OECD iLibrary | Sugar, [no date]. [online]. [Viewed 9 December 2020]. Available from: https://www.oecd-ilibrary.org/agriculture-and-food/oecd-fao-agricultural-outlook-2020-2029_3736a600-en;jsessionid=80bZjxAzpg34HglxJQ0fpdbM.ip-10-240-5-119

Gulf Oil: COVID vaccine & OPEC+ meeting – Gulf oil – Weekly bulletin #3

Price movement recap

From the beginning of November, we have seen a sharp increase in the oil price: the performance is up by 30% on the WTI. The major reason behind this is the positive prediction regarding the vaccines of Pfizer and Moderna. The additional rebound was generated after the decision of the OPEC+ meeting. A consensus on the reduction of the production quotas for 2021 was agreed. Additional 500’000 barrels will arrive on the market every day, which is much less than the initially 1.9 million barrels planned.

WTI spot price:

Source: Bloomberg – USD/Barrel

Futures prices / Cost Curves:

It is interesting to note that the Curves of oil (orange curve) is no longer in contango but in backwardation as of June 2021. It means that traders/market think that the demand will be slightly higher than the supply from June. However, traders do not have a very precise opinion on the curve with both backwardation and contango. Moreover, with a relatively flat slope, it is difficult to affirm with certainty whether is it the supply or the demand that is higher than the other. It is more of a “wait and see” situation.

It’s also interesting to compare the actual future curve (orange) with the curve from a month ago (green). The market was clearly in contango: supply higher than the demand. The situation has evolved a lot since then.

Source: Bloomberg

Supply and demand dynamic

The OPEC and non-OPEC Ministerial Meetings, which were due to take place from 30 November to 1 December, finally took place on 3 December. During this event, they went back on their decisions of 6 June 2020, which consisted of reducing production to an average of 9 mb/d in 2020. The conclusion was that everyone followed the rules.

As for the future, they decided to reduce their production by 0.5 mb/d, from 7.7 mb/d to 7.2 mb/d, by January 2021. In addition, it was decided that there would be a monthly meeting to make adjustments if necessary.

We also think that the Biden’s global energy policy has an impact on the global supply and demand dynamic. Indeed, the climate change is at the center of his energy policy. Biden wants to considerably reduce the energy-related emissions, 15% of which are produced by USA.  He is also determined to rally rest of the world in follow this movement. If this scenario becomes real, the demand for oil may decrease in the medium term.

Recommendations

From an investment point of view, and based on the above, we recommend being long for the next 3 months. As explained, the optimistic forecasts for the vaccine could significantly increase demand, which could generate a backwardation. Moreover, the OPEC+’s decision on the reduction of oil production for 2021 could reinforce this trend.  The situation will need to be analyzed around April 2021, as the slope of the forward curve is relatively flat, and the market could swing back and forth.

Abbas Al-Azawi

Alexis Baeriswyl

Valery Sikorskiy

References

MCCORMICK, Myles and BROWER, Derek, 2020. Biden’s climate agenda goes global. [online]. 3 December 2020. [Viewed 9 December 2020]. Available from: https://www.ft.com/content/b2d315c6-876a-4d95-8c8f-0df4b86ee532

OPEC : The 11th OPEC and non-OPEC Ministerial Meeting concludes, [no date]. [online]. [Viewed 8 December 2020]. Available from: https://www.opec.org/opec_web/en/press_room/5966.htm

OPEC : The 12th OPEC and non-OPEC Ministerial Meeting concludes, [no date]. [online]. [Viewed 9 December 2020]. Available from: https://www.opec.org/opec_web/en/press_room/6257.htm

BOURSE,  Zone,  [no  date].  PÉTROLE  BRENT  (LONDON  BRENT  OIL) :  Graphique  de  Cours  Comparatif  | XBNT  |  XX00000BRENT  |  Zone  bourse.  [online].  [Viewed 8 December 2020].  Available  from: https://www.zonebourse.com/cours/matiere-premiere/LONDON-BRENT-OIL-4948/graphiques-comparatif/

https://www.cmegroup.com/content/cmegroup/en/trading/energy/crude-oil/dubai-crude-oilcalendar-swap-futures.html Le  pétrole  récupère  au  lendemain  d’une  forte  chute,  2020.  Allnews  [online].  [Viewed  8 December 2020].  Available from: https://www.allnews.ch/content/march%C3%A9s/le-p%C3%A9trole-r%C3%A9cup%C3%A8re-aulendemain-d%E2%80%99une-forte-chute

Petroleum,  [no  date].  [online].  [Viewed 9 December  2020].  Available  from: https://www.eia.gov/petroleum/weekly/

COPPER – Bulletin #3

Price movement – Historical price (November-December 2020)

The Y-Axis represents the price of Copper per Metric Ton.

Source: https://www.lme.com/en-GB/Metals/Non-ferrous/Copper#tabIndex=2 – consulted December 9th 2020

Several factors can explain the increase of Copper’s price over the last month. Starting with the increase in demand due to China’s strong growth manufacture-wise as well as its increase in copper stored related to a possible new stockpiling policy by the Chinese Government. The increase in demand is also explained by the still-low level of US dollar’s value and the global economic and manufacturing bounce back due to hope related to vaccines announcements from several countries.

The decrease in supplied quantities due to sanitary reasons in south America and political tensions in Peru (2nd biggest mining country) which created tensions on the investing side. 

For economical reasons, the crossing between supply and demand in the above-mentioned situation implies an increase in price.

Price movement- Forward Curve

Data source: https://www.cmegroup.com/trading/metals/base/copper.html – consulted December 9th 2020

The graphic shows that the forward curve on the 09.12.2020 is different from the one on the 18.11.2020 and the one from 29.20.2020. The price of the forwards in the 09.12.2020 is higher than the ones before, we can therefore assume that the market is doing better than expected. 

The curve is relatively flat with a small contango. The small contango suggests that the supposition of the market today is that the supply over the year is going to be relatively good. Yet, the fact that it is almost flat suggests that the market is uncertain towards the evolution of Copper’s price and that it can go up as it can go down more or less quickly. 

The uncertainty can be related to different aspects. The first one is that investors fear the coronavirus crisis might worsen and this could result in a shortage of supply, or lower the demand due to the lack of economic activity. But, since the UK started vaccinating people on the 08.12.2020 and many other countries are following, the worries about COVID-19 are lower than before. Observers expect the COVID-19 to ease in the future.

The instability of the dollar index is also affecting the demand and supply of the copper as all the commodities traded on the CME market.

Illustration of supply and demand dynamic of copper

Source: http://www.kitcometals.com/charts/lmewarehouse.html – consulted December 9th 2020

Warehouse stocks level of copper is running low for mainly 2 main reasons:

  • The Chinese economy is the only one growing correctly due to a serious control of the COVID19. There is no lockdown anymore and Chinese production/consumption of copper for infrastructure is getting back to the usual level despite a lower supply level than “usual”.
  • Markets like Europe are looking to boost their inventories because if a vaccine is found, the sector of renewable energy, electric vehicles and manufacturing will need a reserve of copper.

The supply from countries like Chile are still impacted by the COVID19 and the production did not catch up to the normal level from the previous year. The demand is high due to the recovery of China, the weakening of the US dollar and an expected future economic recovery in the majority of importer’s countries. Both of these factors are driving copper’s price high as we can see on the historical graph and the future’s market price.

Recommendations to be short or long for the next 3 or 6 months

The forward curve on the 09.12.2020, has a small contango yet it’s relatively flat, we would advise going long for the next 6 months. We think that the economic activity will pick up hard after the administration of vaccines all over the world, the administration of vaccines will take months, but after the economic activity picking up, a shortage of copper will appear and that will be the moment to go short and sell what have been bought now. 

Sources

BFM BOURSE, Cac 40: Le cours du cuivre s’envole à un sommet depuis Mars 2013, published December 6th 2020, consulted December 9th 2020, available from: https://www.tradingsat.com/cac-40-FR0003500008/actualites/cac-40-le-cours-du-cuivre-s-envole-a-un-sommet-depuis-mars-2013-943515.html 

MINING JOURNAL, Copper news, published December 2nd 2020, consulted December 9th 2020, available from: https://www.mining-journal.com/copper-news/news/1400534/chile-copper-production-down-in-october 

ECONOMIES.COM, Copper turns lower as investors grow more cautious, published December 3rd 2020, consulted December 9th 2020, available from: https://www.economies.com/commodities/copper-news/copper-turns-lower-as-investors-grow-more-cautious-36967

https://www.economies.com/commodities/copper-news/copper-rises-on-strong-demand-and-falling-dollar-36918

CAPITAL.COM RESEARCH TEAM, Copper price forecast for 2021: moderately bullish with strong headwinds, published October 28th, consulted December 9th 2020, available from: https://capital.com/copper-price-forecast-2021

by Ismail MODAFFAR IDRISSI, Tashi JARRON & Amélia REUSSER

A cocoa company is making waves on the market

Cocoa news: 

In recent weeks Hershey Company, one of the world’s largest chocolate manufacturers, has adopted an unconventional cocoa beans sourcing approach (Wink 2020). Indeed, in mid-November, the multinational acquired this commodity through ICE Future exchange.

The deals with middlemen account for the majority of cocoa beans sourcing globally. By adopting this new approach, the manufacturer is avoiding usual premiums. It represents a major change in the Hershey strategy. Traditionally, the company is using physical sellers to supply beans, not ICE Future exchange.

Coffenews: 

A manager of Tanzania Coffee Board (TCB) has declared to be positively surprised regarding the impact of the COVID-19 on the commodity (Tempa, 2020).

As shown below, the Coffee Futures prices have not seen significant variations. Currently, the new pandemic only affects the transportation of the commodity to overseas markets but it saved the export prices. In 2019, the price at local Tanzanian auctions was around 119$ for a 50kg arabica bag. It was not far below the 133$ on November 5 of this year.

However, for the same quantity of coffee, the export prices were only about 116$. The situation is also similar regarding the more affordable coffee variety, the robusta. Local prices are higher than the export prices.

According to the same TCB manager, this situation can be explained by the quality increase of Tanzanian coffee, the drop of coffee consumption due to the COVID-19 and recent decreases in price for the rest of the market.

Cocoa price

Due to the situation mentioned above, the Cocoa’s forward curve has slightly increased the backwardation it was in. The curve on 18 Nov. 2020 was already pricing in the situation and as it has not been resolved the near term contract has only slightly moved. The spot contracts have also partially priced in the additional 400 USD / MT required by Ghana and Côte d’Ivoire amounting to 2636 USD / MT which is 206 USD over the price prior to Hershey’s ICE deal.

Cocoa forward curve comparison, as of 09/12/2020

Cocoa historical price, as of 09/12/2020

Coffee price

The coffee’s forward curve has only slightly moved lower compared to the previous bulletin and its shape has not changed. The lack of major events, with the overwhelming situation of lock-down due to COVID 19, is not perturbing the long-term market. Interestingly, Starbucks just released its forecast for 2021 with an increase in consumption of up to 12%.

Coffee forward curve comparison, as of 09/12/2020

Coffee historical price, as of 09/12/2020

Recommendation

Cocoa

The second COVID-19 wave hitting Europe has not impacted as much as fear the demand for cocoa. In addition, the new vaccine homologations submitted by several pharmaceutical companies (Yahoo, 2020) could lead to a decrease in the pandemic in developed economies. Thus, the decline of the COVID-19 can allow an increase in demand because the employees would return to their workplaces. Finally, if Hershey Company continues with its new sourcing strategy it could push the prices higher for the following months.

Coffee

As previously described in this bulletin, there was a lack of important events in relation to this commodity from the last 18 November bulletin 18 Nov. However, as for the cocoa, the vaccine campaigns which are about to begin in numerous countries including the US and Western European countries could positively influence the world demand.

Disclaimer

This publication is for your information only and is not intended as an offer, or a solicitation of an offer, to buy or sell any investment or other specific product. The analysis contained herein does not constitute a personal recommendation or take into account the particular investment objectives, investment strategies, financial situation and needs of any specific recipient.  It is based on numerous assumptions

Reference

  • “CJ: NMX Historical Data”. NASDAQ, 2020, https://www.nasdaq.com/market-activity/commodities/cj%3Anmx/historical. Accessed 09 Dec. 2020.
  • “KT: NMX Historical Data”. NASDAQ, 2020, https://www.nasdaq.com/market-activity/commodities/kt%3Anmx. Accessed 09 Dec. 2020.
  • Temba, Florah. “Tanzania Coffee Prices Rise Despite Impact Of Covid-19”. The Citizen, 2020, https://www.thecitizen.co.tz/tanzania/news/business/-tanzania-coffee-prices-rise-despite-impact-of-covid-19-3214982. Accessed 9 Dec 2020.
  • “US Stocks End At Fresh Records On Vaccine Progress, Extending Rally”. Au.Finance.Yahoo.Com, 2020, https://au.finance.yahoo.com/news/equities-mixed-focus-vaccine-virus-033442598.html?guccounter=1&guce_referrer=aHR0cHM6Ly93d3cuZ29vZ2xlLmNvbS8&guce_referrer_sig=AQAAALqSfEEZSSRWhA52irBjuuBXUNh302fBSGYymUtUZljigqtm_AvTTfEBOfhZetNu-ihpMjLq8_LnUvFxg5ZHvE1VL1hQjslfFcQcenFUbK3lfnZDWnn8dMJ_g0G1-ByTJoXvyhvv6jKRTwSS2kk6pg1ozfdwwOWnGYtpbz-6aDqh. Accessed 10 Dec 2020.
  • Winck, Ben. “Hershey Drove A Record Spike In Cocoa Prices After Reportedly Sourcing Beans From The Futures Market Instead Of Physical Sellers”. Markets.Businessinsider.Com, 2020, https://markets.businessinsider.com/commodities/news/hershey-cocoa-futures-record-spike-commodity-futures-market-ice-exchange-2020-11-1029831388. Accessed 9 Dec 2020.

Bulletin#2_Battery Material

Cobalt :

As we know from the market overview, DRC accounts for roughly 70% of world mined cobalt and Chinese companies account for 8 out of 14 cobalt main refineries. A market completely dominated and controlled by the two.

Contained cobalt in reserve (thousand tons)
Image source from: https://www.visualcapitalist.com/ethical-supply-the-search-for-cobalt-beyond-the-congo/

By the time cobalt arrives for the battery manufacturing, the sources of cobalt are unknown. We do not know where it comes from anymore but since DRC is accounting for more than half of world production, it is normal to think that there is a very high chance that it comes from there. DRC has been under the radar for being a country where children are known to be working in Cobalt mines. Moreover, the working conditions have been reported to be very poor and unfortunately led to the death of thousands of people.

Images from: https://www.visualcapitalist.com/ethical-supply-the-search-for-cobalt-beyond-the-congo/

A lawsuit against the big Tech companies such as Apple, Microsoft, Tesla and Google has been launched in the end of 2019[1]. Congolese families are asking for damages: as mentioned above, the big techs are being accused to aid force labour, children labour and poor working conditions. Companies are now seeking a more transparent supply chain but also other sources in other to be sure that the Cobalt they are buying is considered “clean”: BMW signed a $110mio deal with Morocco’s cobalt company Bou Azzar Mine, Tesla has agreed to buy 6’000 tonnes/year of Cobalt from Glencore (we will see why further down); Companies such as Ford, IBM and LG are using block chain technology to trace accurately the source of their cobalt[2]; More interestingly, north America, Canada, explorations have started in order to find new sources of Cobalt[3]

A lawsuit against the big Tech companies such as Apple, Microsoft, Tesla and Google has been launched in the end of 2019[1]. Congolese families are asking for damages: as mentioned above, the big techs are being accused to aid force labour, children labour and poor working conditions. Companies are now seeking a more transparent supply chain but also other sources in other to be sure that the Cobalt they are buying is considered “clean”: BMW signed a $110mio deal with Morocco’s cobalt company Bou Azzar Mine, Tesla has agreed to buy 6’000 tonnes/year of Cobalt from Glencore (we will see why further down); Companies such as Ford, IBM and LG are using block chain technology to trace accurately the source of their cobalt[2]; More interestingly, north America, Canada, explorations have started in order to find new sources of Cobalt[3]

Image source: https://www.visualcapitalist.com/ethical-supply-the-search-for-cobalt-beyond-the-congo/

The industry is recognizing the fact that there are other sources that can be compared to what is found in the DRC. Canada is a good candidate with a possible large amount of Cobalt to be mined in Ontario. A good sign that is proving this fact is that Glencore, the biggest mining company in the world, owns many land in the area and has built the very first cobalt refinery in north America. This means that refined cobalt will be traceable from there and considered as “clean”.

https://www.google.com/maps/place/Ontario,+Canada/@48.9552626,-93.7065152,5z/data=!3m1!4b1!4m5!3m4!1s0x4cce05b25f5113af:0x70f8425629621e09!8m2!3d51.253775!4d-85.323214 
A discovery of substantial cobalt reserves in the region would distort the actual Cobalt supply chain, which is, like mentioned previously, a DRC-China monopoly market with no clear sourcing tractability. We could also expect a price drop due to a new source of supply. If Glencore or others manage to build new cobalt refineries, it could also help refined cobalt

to be cheaper and less dependent on China (let us remember that China produces 80% of

the world’s refined cobalt)[4].  Tesla has also announced that it would reduce its cobalt usage for their batteries in the near future[5].

There is no denying that the EV growing demand and the consumer electronic market will drive cobalt demand higher: In the short term, we could see Cobalt’s price increasing while in the long term, for the reasons mentioned above, we could see it decreasing. A market to follow. 

Lithium:

China is striving for global leadership when it comes to Lithium by controlling the supply chain.

It’s used in batteries, glasses, ceramics, pharmaceuticals, and aluminium and magnesium alloys, aerospace industry, bicycle frames and high-speed trains. It is also used in some non-rechargeable batteries for things like heart pacemakers, toys and clocks.

China is the world’s largest manufacturer of mobile phones, computers, televisions and automotive industry. And the EV industry is expanding significantly and that’s why China is the largest consumer of lithium which is an essential metal in producing batteries. 

When it comes to production, China is among the five top countries with the most lithium reserves and was producing 25% of the world’s lithium as of 2019. According to the 2020 USGS report, China has been buying stakes in mining operations in Australia and South America where most of the world’s lithium reserves are found. In 2020, China’s Tianqi Lithium now owns 51% of the world’s largest lithium reserve, Australia’s Greenbushes lithium mine. Which would eventually increase the production of Lithium. The Same company also paid about $4 billion to become the second-largest shareholder in Sociedad Quimica y Minera (SQM), the largest lithium producer in Chile.[6]

Another Chinese company, Ganfeng Lithium, now has a long-term agreement to underwrite all lithium raw materials produced by Australia’s Mount Marion mine, the world’s second-biggest, high-grade lithium reserves. (1) . All these actions will mean that China would be the biggest player in this game and investing a huge amount, becoming the largest producer and the consumer and hence will be manipulating the prices. Moreover, making others dependent on China to whom it can sell the lithium on a price higher than the spot price. The dependence on China for lithium will affect the electric vehicle ecosystem even more than other sectors because 40% of the cost of an electric vehicle is attributed to its battery. “China’s dominance of the industry is to be expected given its huge investments and the policies the country has implemented over the past decade.” [7]

Moreover, it is interesting to see how the EU, US and other countries are trying to find alternatives and solutions in order to not be dependent on China. For example, a $20 million investment led by a Bill Gates-backed fund into a lithium-mining technology firm, called Lilac Solutions, is considered to be a “game-changer”. The firm stated that “its ion exchange technology is twice as efficient as the current mining process and takes a fraction of the time.” The technology could also unlock the vast potential of Bolivia, which has the world’s largest lithium resources but doesn’t produce any because of tricky weather conditions. If you have a lot of weather like rain and clouds, it makes it very difficult to extract. [8].

Graphite:

A look back at 2019

China shifts away from upstream production of graphite towards downstream production. The country increased its imports of graphite mainly from Africa. China imported more than 53,000 metric tons of natural graphite in the first three quarters of 2019 (mainly from Mozambique and Madagascar), compared to just 12,000 metric tons in the same period of 2018.

This triggered volatility in the market. In September, the Balama graphite project in Mozambique (the largest natural graphite project outside China) decided to reduce its output. The company cut back production from 15,000 metric tons per month to 5,000.[9]

There is no standard, quoted prices for natural graphite and there is no spot or futures market. After peaking in 2012, graphite prices experienced a sharp drop due to the slowdown in the Chinese economy and a lack of growth in western economies. Since that time they have been sideways to down as the market waits for continuing growth in the battery industry to use up excess capacity in China. [11]

2020

Supply dynamics have evolved since 2017 because of projects led by producers outside China, including Syrah Resources. The Syrah Resources are an Australia-based graphite miner with operations in Mozambique. Syrah’s flake graphite exports to China amounted to about 75% of China’s total flake graphite imports in 2019. This flipped China from being a major exporter to a major importer of graphite. Additionally, China’s own graphite resources are becoming deeper and more expensive to mine. As a consequence, China is investing in Africa which is logistically useful for Chinese customers and has major graphite resources. China has a recent history of investing in Africa, which has relatively cheap labor and other overheads.

Graphite consumers outside Asia, especially those in Europe and the United States, are expected to diversify their supplier base because of skyrocketing costs for freight from China and the strength of the East Asian country’s yuan. Soaring freight rates and container shortage during the Covid-19 pandemic disrupted graphite supply outside of China. Additionally, production from Africa has slowed since Syrah halted output from its Balama mine in Mozambique in March. [10]

Sources :

  1. https://www.theguardian.com/global-development/2019/dec/16/apple-and-google-named-in-us-lawsuit-over-congolese-child-cobalt-mining-deaths
  2. https://www.visualcapitalist.com/ethical-supply-the-search-for-cobalt-beyond-the-congo/
  3. https://www.bloomberg.com/news/articles/2020-07-07/bill-gates-backed-company-to-hunt-for-cobalt-near-glencore-mine?sref=53TBor5N
  4. https://www.mining.com/chart-chinas-stranglehold-on-electric-car-battery-supply-chain/
  5. https://www.reuters.com/article/us-tesla-china/tesla-to-roll-out-china-made-model-3-cars-with-cobalt-free-lfp-batteries-sources-idUSKBN26L26S
  6. https://qz.com/1812892/coronavirus-may-have-lasting-effect-on-china-dominated-lithium-sector/
  7. https://mercomindia.com/china-leads-lithium-ion-battery/
  8. https://qz.com/1805808/bill-gates-led-investment-may-be-game-changer-for-lithium-mining/
  9. https://investingnews.com/daily/resource-investing/battery-metals-investing/graphite-investing/graphite-outlook/
  10. https://www.metalbulletin.com/Article/3963483/Graphite/FOCUS-Surging-freight-rates-encourage-demand-shift-in-graphite-market-sources-say.html
  11. http://www.northerngraphite.com/about-graphite/graphite-pricing/

Soybean – Bulletin 2 – 2020

PRICE MOVEMENT RECAP

The graph shows that the price continues to increase as expected. The worldwide supply is currently low since latin american producers are not in their harvest season and that the US is done with their harvest season. Moreover, the production of soybeans in Brazil and Argentina is uncertain because of the La Niña phenomenon. There have been extreme low rainfalls, altering the growth of soybeans. Now, the lands are extremely dry, which will postpone the planting season and thus alter the supply. Although Argentina seems to experience better weather, their contribution to the worldwide production is not significant enough to make up for other countries’ decreasing production. The consequences of this is that the supply is low but the demand is high, since China is continuing to buy a lot from the US. Thus, the price will continue to increase. 

What is interesting is that some chinese importers are willing to cancel the purchase of some of the agreed US cargoes for December and January, since they have not entered into a futures contract before, as they were not expecting such a rise in the price. Importing soybeans at the current price means that they would lose money. The potential consequences on the price remains unknown since the size of the cancelled cargoes has not been disclosed.

Additionally, Biden’s administration is expected to maintain the US’ trade tariffs policy on China, but will be more predictable to China compared to Trump’s administration, as said by Lee Heng Guie, executive director of the Associated Chinese Chambers of Commerce

Worth mentioning that the Biden administration is focused on multilateral approach.

China has committed to purchase US$36.3 billion worth of US agricultural products, including soybeans, in 2020 and US$43.3 billion in 2021 as agreed in the Phase 1 of their agreement on trade. 

However, China has been buying more soybeans from Brazil than usual, resulting in Brazil selling more than the US to China. 

Therefore, as Brazil had to sell more to China, both countries needed to buy soybeans from the US to meet their requirements. This results in a tight supply and demand, increasing soybean prices.

INVENTORY

When it comes to the world ending inventory of soybeans, they unsurprisingly declined over the past three years as shown below:


Source: CME Group

Even though much of it can be attributed to Brazil, the ending stocks of US soybeans have significantly dropped as well (-333 million of Bushels, which represent a decrease of 64% from year 19/20 to year 20/21) which is explained by a reduced production in most of the producing states, and an increasing demand mainly from China, but also from Brazil, which has been forced to import US soybeans since their local production was altered due to reduced rainfalls. In fact, the situation is such that 20/21 could record the lowest ending stocks of soybeans since five years, according to the Agriculture and Horticulture Development Board.

SUBSTITUTES

CORN

Corn is a substitute for soybean that China is using to feed livestock. This, coupled with the plunging Ukrainian production resulted in a 32% price increase between June 1st and November 30th

CRUDE PALM OIL

Soybean and palm oil are considered substitute goods because importers can easily switch between the two commodities. Most of the world’s palm oil production is located in Indonesia and Malaysia. There is a high volatility in the spread relationship between the two commodities because a drought in the United States could alter the soybean oil supply one year, while disease in Southeast Asia could alter the palm oil supply next year. 

The two markets tend to move together. In fact, with the increase of soybean prices, this increases the price of crude palm oil as well. 

In 2017, Malaysia exported 2.87 million tonnes of palm oil to China. However, the trade agreement between the US in China might in the long term affect the Malaysian exports of CPO. China might buy more soybean from the US than CPO from Malaysia.

RECOMMENDATION

As discussed, the production (supply) is uncertain for the following months due to weather issues in Latin America. Moreover, the demand is still high, showing an increase in the price. Since the production is uncertain coupled with COVID-19, the price will continue to increase and we can expect stocks at the beginning of the year to be lower compared to the previous years. We recommend going long over the next months as the supply will remain low. 

With the US-China trade agreement, we can assume that the export (from the US) of soybean will drastically increase. However, this remains uncertain as China may “washout” imports from the United States.

REFERENCES

China Says Its Grain Imports Not to Blame for Global Price Surge – BNN Bloomberg, [no date]. [online]. [Viewed 2 December 2020]. Available from: https://www.bnnbloomberg.ca/china-says-its-grain-imports-not-to-blame-for-global-price-surge-1.1529331

Chinese buyers look to cancel U.S. soybean orders as processing margins shrink | Reuters, [no date]. [online]. [Viewed 2 December 2020]. Available from: https://www.reuters.com/article/us-china-soybeans-cancellations/chinese-buyers-look-to-cancel-u-s-soybean-orders-as-processing-margins-shrink-idUSKBN28510H

Corn Prices – 59 Year Historical Chart, [no date]. [online]. [Viewed 2 December 2020]. Available from: https://www.macrotrends.net/2532/corn-prices-historical-chart-data

Cover Story: ‘Predictability’ is the word to describe Biden’s trade war approach, 2020. The Edge Markets[online]. [Viewed 2 December 2020]. Available from: http://www.theedgemarkets.com/article/cover-story-predictability-word-describe-bidens-trade-war-approach

FEEDNAVIGATOR.COM, [no date]. Bullish picture for maize and soybeans. feednavigator.com [online]. [Viewed 2 December 2020]. Available from: https://www.feednavigator.com/Article/2020/11/12/Bullish-picture-for-maize-and-soybeans

Geosys How is La Niña impacting Brazilian and Argentina crops?, 2020. UrtheCast [online]. [Viewed 2 December 2020]. Available from: https://www.urthecast.com/how-is-la-nina-impacting-brazilian-and-argentina-crops/

snd_cbt.pdf, [no date]. [online]. [Viewed 2 December 2020]. Available from: https://www.cmegroup.com/trading/agricultural/files/ht_charts/snd_cbt.pdf

spreading-cbot-soybean-oil-and-bmd-crude-palm-oil.pdf, [no date]. [online]. [Viewed 2 December 2020]. Available from: https://www.cmegroup.com/trading/agricultural/files/spreading-cbot-soybean-oil-and-bmd-crude-palm-oil.pdf
wasde1120.pdf, [no date]. [online]. [Viewed 2 December 2020]. Available from: https://www.usda.gov/oce/commodity/wasde/wasde1120.pdf

Group 3 – K
Maxime DOLLA, Mahona PENNA, Romane POUCHON