By Lyticia Wouguia, Christopher Delfin, Piratharsan Poologanathan
Chinese Market
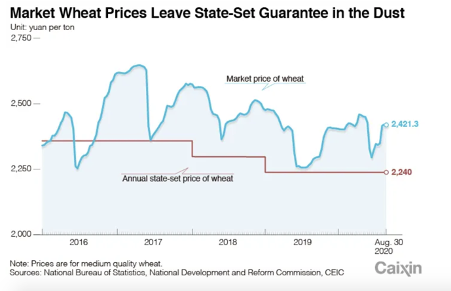
The chinese farmers expect the price to rise with the Covid-19. Thus, they prefer to stock the wheat instead of selling at the current price. As stated in the below chart, even though the current fixed price by the Chinese government is 2240 YUAN and the market price is above,consequently chinese farmers prefer to store the commodity. This may be explained by the fact that the australian wheat is about to be banned. In fact many other commodities are already banned and the wheat is expected to be banned at its turn. The uncertainty is quite high and may challenge de traders. As a matter of fact, at least for the other commodity, the embargo affected even for transaction already made.
Source: Caixen
Australian future market
It is reported that these past few weeks, Australia is having good weather conditions which makes the production of wheat a lot easier. The table below is indicating that the situation of the wheat futures is normal. Compared to our 1st bulletin, the future market of wheat in Australia does not face the seasonality. In fact, it has a steady increase in the future’s price. This is due to expecting renewed relationships with traditional customers who have been buying wheat from other countries over the past few years because Australia has been facing poor seasons. It is expected that the traditional Asian consumers such as Vietnam, Philippines, Thailand will be actively seeking offers of Australian wheat on account of superior quality relative to other origins.
Source: Barchat
Australia and Argentina’s export situation
Source: farmweekly
In 2020/2021 the wheat harvest is estimated at 27.9 million metric tons. This represents an increase of more than 84% over the previous season. Australian wheat exports are set at 17 MMT for the 2020/21 season, due to a larger exportable surplus created by favourable growing conditions in much of Australia this season. Western Australia’s wheat production for 2020/21 is about 8MMT, with APW (Australian premium white) and AH (Austarlin Hard Wheat). Argentina is in direct competition with Australian wheat exports and has gained market share in the Asian region over the past two years, not only for wheat but also for other feed grains such as maize.
The latest update from the Buenos Aires office of the US Department of Agriculture has reduced Argentina’s wheat production for 2020/21 to 17.4 MMT. This corresponds to a downward revision of wheat exports to 11.2 MMT, a 15 % drop from the previous year. The decrease in exports can be attributed to lower production due to dry weather (the La Nina phenomenon, which brings wetter than usual conditions in Australia, has the opposite effect in Argentina with drier than usual conditions) but also to increased competition from Australia.
Australian wheat is one of the cheapest in the world, which means that it is well placed to take advantage of strong international demand.
Recommendations
The potential ban from the Chinese government, might increase the price of the local production wheat. Therefore we recommend investing now. The global price of wheat is not likely to be touched by those measures.
Despite uncertainties about the second wave of covid-19, the fall in prices was limited due to disruptions in oil supply in several regions. Recent information about a possible vaccine and the demand for oil in China and India have supported the rising trend. Hedge funds and fund managers have slightly modified their positions in response to covid-19 uncertainties and global demand predictions, but this has not stopped the upward trend in prices. Nevertheless, the decrease in US oil stocks in coupled with the price war between Russia and Saudi Arabia is impacting the market.
In Europe, the value of Urals (medium sour crude) is at a premium against Brent (light sweet) due to the strong demand from Mediterranean and Asian refiners. In addition, the value of Urals is supported by a lower loading in November than in October due to increased demand from Russian refineries. Furthermore, the difference between a high supply and a low demand for Brent crude coupled with an increase in American and Libyan exports add further pressure on the latter.
The forward curve shows a sustained contango in October as oil supply and demand prospects deteriorated. The supply of cargoes remained modest, while floating storage in the North Sea was significant. The COVID-19 disruptions have affected trade. High stocks and the development of floating storage also had a negative impact.
Supply and Demand drivers, and stock levels
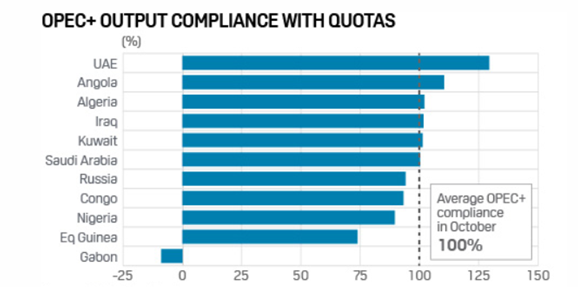
There are a few key factors that influenced the supply and demand, the first to consider is the ongoing deal of the OPEC+ members, concerning the planned reductions in oil productions. The members originally planned on cutting more of their production by 2 mbp .Though, the recent discussions, on November 17th were not decisive and they planned on not cutting the supply before seeing how the situation is going to evolve and postponing a decision to January 2021. As a matter of fact, Russian oil producer recently met with the country’s Energy Minister, and let hear that they were not ready to accept deeper cuts, and that all they could do was keeping on going with the actual reduction, but not more than this.
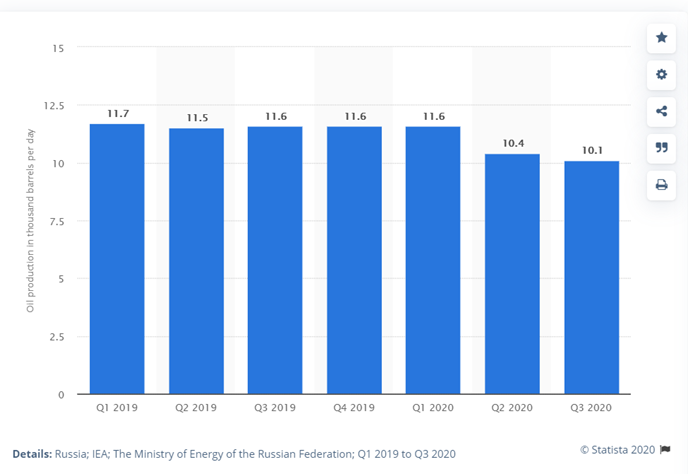
Russian Oil Production in thousand barrels per day
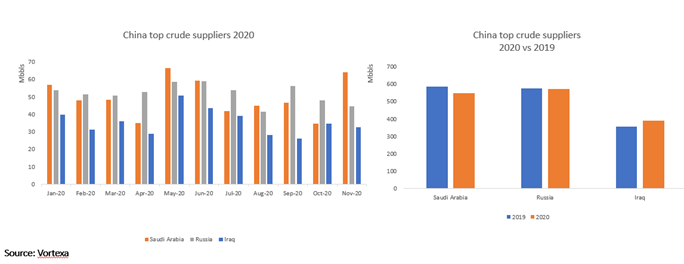
Another very important point that influences the supply and demand of Russian crude oil is the ongoing “war” with Saudi Arabia, where both want to become the first supplier of China, as they are taking advantage of the very low oil price. Both Saudi Arabia and Russia are trying to cope with the high demand and win the Chinese market, boosting their export to China, whose demand is still going strong despite the Covid-19 pandemic and the global demand being low. For the past year, Russia was ahead in term of export, but the latest month their first place was taken by Saudi Arabia
Asia is a very important market for Russian crude, and it doesn’t only involves China, Asian country are entering a bidding war on the price to ensure that they will secure their supplies, an example being cargoes from Russia being bought at very high prices, such as Chinese and Japanese buying Russian ESPO (Eastern Siberia–Pacific Ocean oil pipeline) at a five-month high premium price. What could further influence the demand and supply is the fact that Asian refiner are lacking oil supply contract from OPEC members, and they will most probably turn to Russia, who is fully able to respond as they didn’t cut production as much as planned.
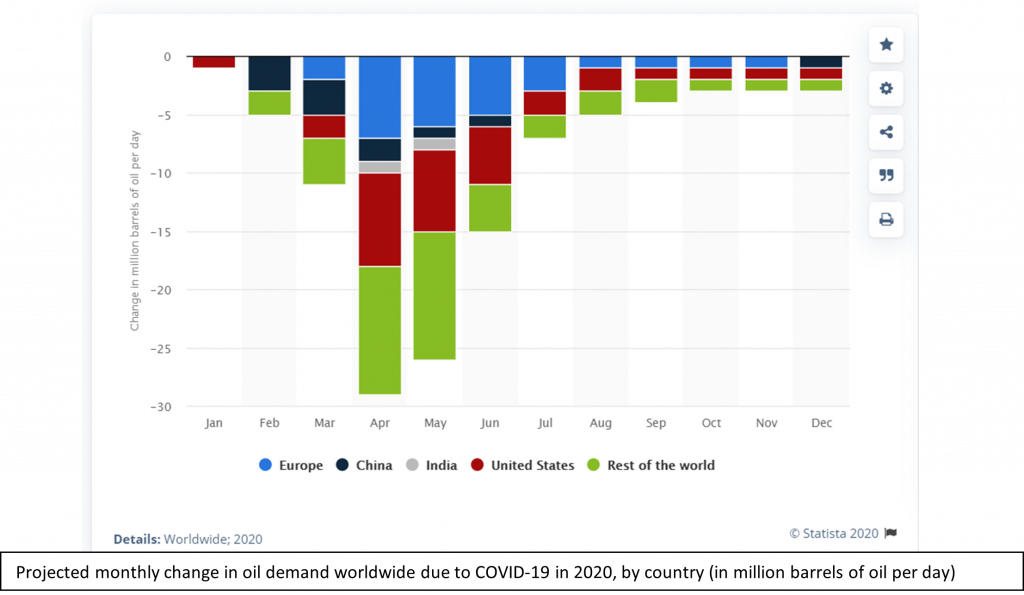
As for the demand, it could improve depending on the evolution of the Covid-19 pandemic as hope for a vaccine could improve it, but still, this remains to be seen. As of now, analysts say that the oil demand is usually low in the first quarter of the year, and the fragile oil market may not be able to absorb the additional supplies, that means that the OPEC+ deal cuts are very important and that the parties involved should respect the cuts in quantity they planned on.
Finally, a last factor could also influence the demand. Northeast Asian countries, such as Japan and South Korea, are expecting very cold winters, and it could benefit Russia. In fact, some producer from far East Russia are already planning on making short haul delivery to those country and boost their kerosene output to cope with the incoming demand. And, the time necessary for a delivery from far East Russia to Northeast Asia being only around a week, compared to the 10-15 necessary from South East Asia, the concerned country will most likely take advantage of Russia’s oil supply.
As for the stock levels, Russia’s energy sector being totally state controlled, and the country being the opposite of transparent, it is extremely hard to find up to date data. However, the inventory levels were of 13 billion metrics tons in the beginning of 2020, according to the US Energy Information Administration, while they were of 14,7 billion metrics in 2019.
Recommendations
The demand from Asia and the production cuts driven by members of OPEC+ have a positive impact on the market. Based on the information provided in this bulletin, we advise a long position and to be attentive to the information that will result from the next OPEC+ meeting.
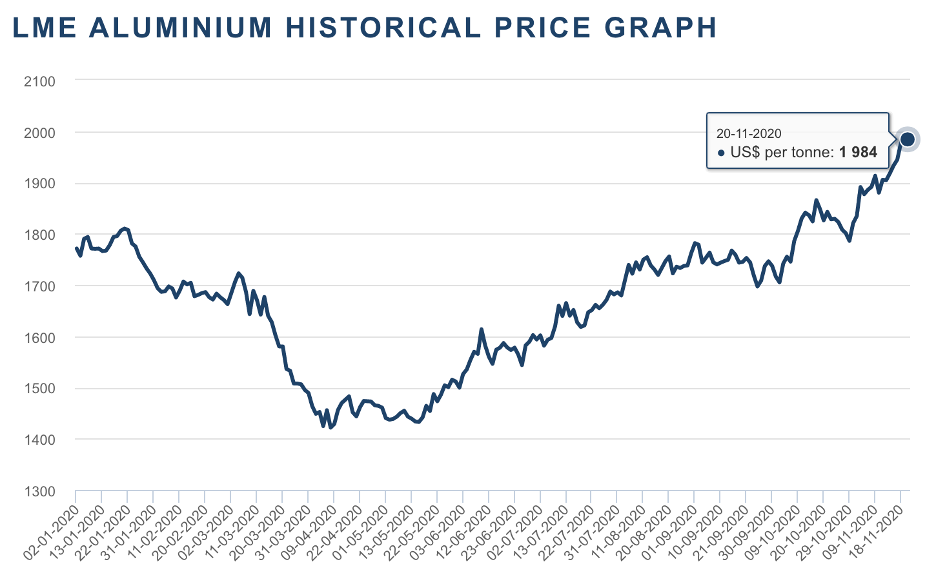
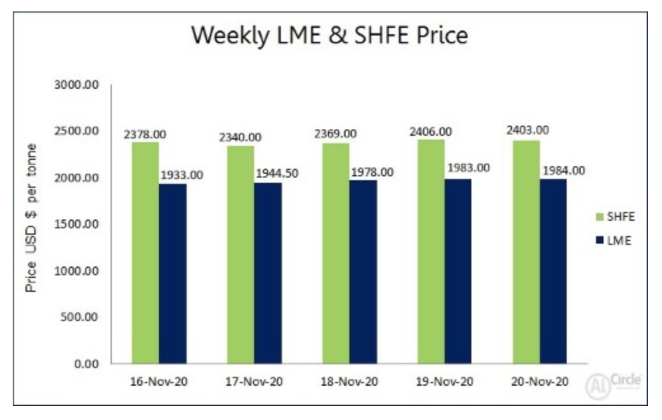
While on the 30th October the price of aluminium was USD 1820.5, the latter kept increasing to reach on the 20th November 2020 its highest since the beginning of the year, meaning even before COVID-19.
This high price is mainly due to a destocking effect following the increasing demand of China. The Chinese government is willing to considerably develop its infrastructures as it is part of its “Made in China 2025” project and relies heavily on aluminium. China’s economy has rebounded from COVID-19, particularly due to government spending.
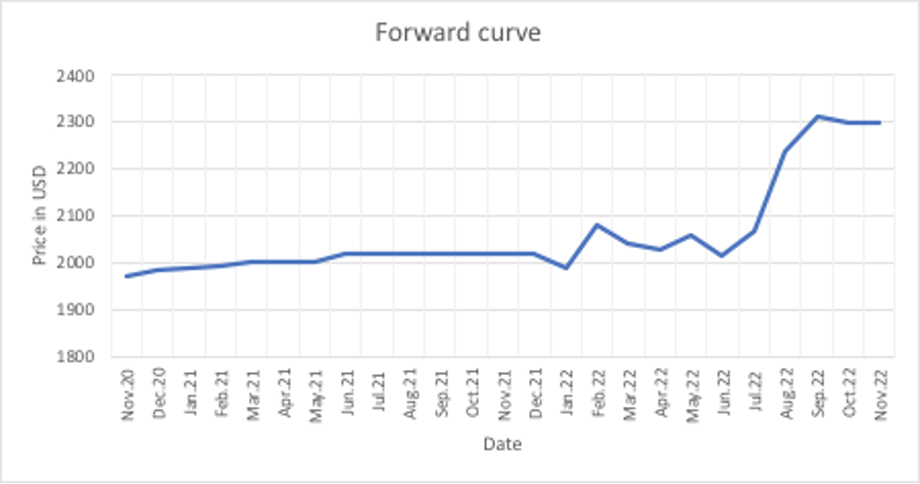
Forward curve
Sources: CME Group
The market is showing a slight contango until November 2021 due to the decrease in inventory level. However, the market is not confident, any sudden change in supply or demand will make the market shift. We can see that the later the delivery date is the more fluctuations there are in the price. After going from some shift between contango and backwardation, the market is seen as being well-supplied from mid-2022.
Supply and demand dynamic
At the beginning of the month, the US market has been looking closely at the national elections as the outcome of the election is very likely to impact the recent Section 232 aluminium tariffs imposed by the Trump Administration. The election process and the refusal of Mr. Trump to recognize its defeat has been creating uncertainty and difficulty to plan. Nevertheless, the real impact on the US aluminium market will not be immediate. As a matter of fact, the Biden administration will not be able to completely remove the tariffs and smoothing the tariffs will take time.
In addition, the announcement of a possible vaccine for the COVID-19 which would re-boost transportation industries as well as the positive macro environment of China as said above leads to a demand optimism in 2022.
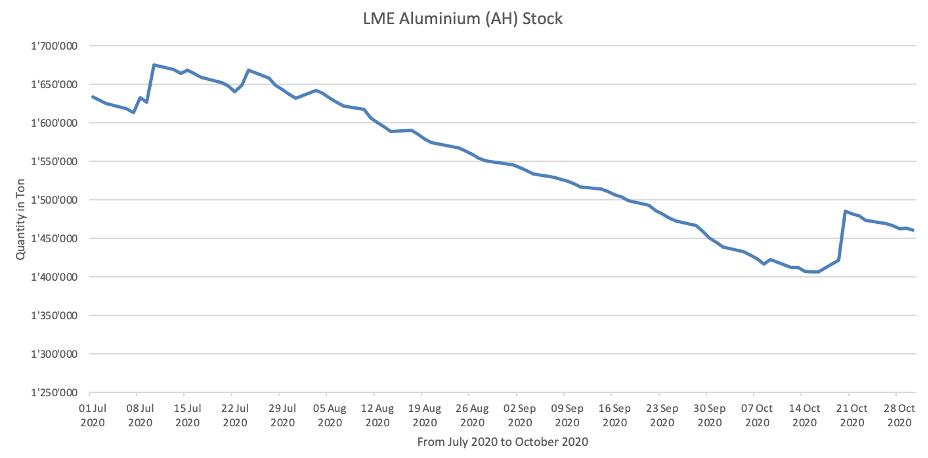
Inventory levels
Sources: AL CircleSource:London Metal Exchange
As we can observe, since the middle of July, there has been a constant decrease in the stock. This might be caused by the importation of China of Aluminium, in August and September, they reached the second-highest importation volumes for 11 years. This is the direct consequence of the decrease of stock on SHFE where the price is even higher than on LME. China is consuming almost all its production. As a result, the price of LME is still increasing.
Recommendations
Because of the decrease of inventory and the slight contango, we recommend to secure the supply and to remain long for the next couple of months.
With a possible vaccine on the horizon, we could potentially see an increase in demand in industries such as the automobile and other transportations worldwide.
Beatriz Ferreira Caetano, Virginie Gruaz and Mingxin Ma
Apparent aluminum deficit drives up spot prices against longer dates | MineralPrices.com Breaking news source for precious, battery, platinum group, base, iron and steel, minor, rare earths, quotes and research from various qualified sources., [no date]. [online]. [Viewed 23 November 2020]. Available from: https://mineralprices.com/apparent-aluminum-deficit-drives-up-spot-prices-against-longer-dates/
China reverts to net aluminium exporter in Sept; imports remain strong | MineralPrices.com Breaking news source for precious, battery, platinum group, base, iron and steel, minor, rare earths, quotes and research from various qualified sources., 2020. MineralPrices.com [online]. [Viewed 23 November 2020]. Available from: https://mineralprices.com/china-reverts-to-net-aluminium-exporter-in-sept-imports-remain-strong/
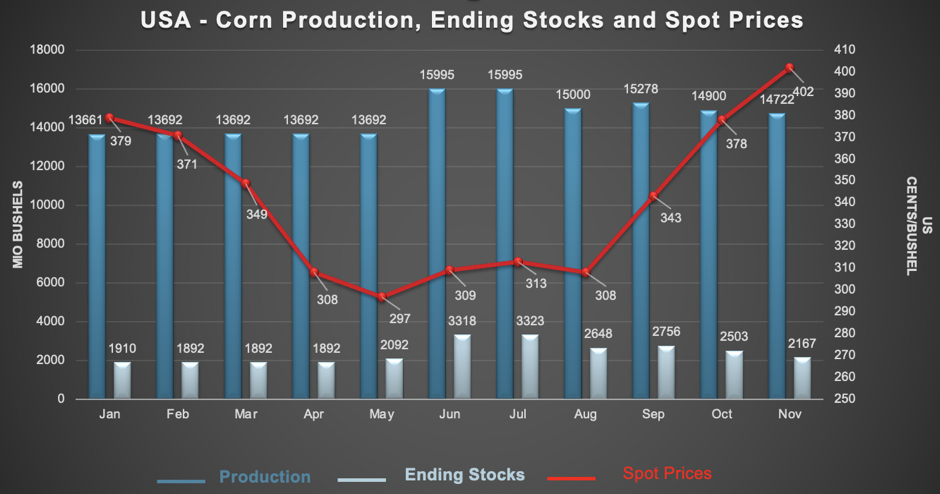
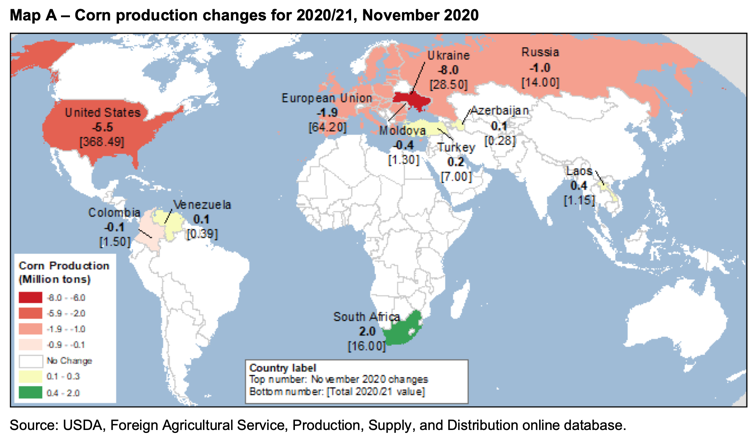
From October to November, the corn spot price has risen to about $4 a bushel, an increase of about 40 cents from last month’s forecast. This is a result of the decrease of production outlook and the increase in the US exports (increased foreign demand and decreased foreign production).
U.S. maize production is expected to be 14’722 million bushels, based on lower national maize yields, a 178 million bushel decrease from the previous month due to a smaller harvest and lower beginning stocks.
Ukrainian maize production and exports have both collapsed due to hot and dry conditions, establishing a global supply gap for exports giving export opportunities for U.S. corn. Ukraine being the 4th largest exporter of corn. Lower production in Ukraine, the EU, Russia and Moldova more than compensating the increases in South Africa and Laos.
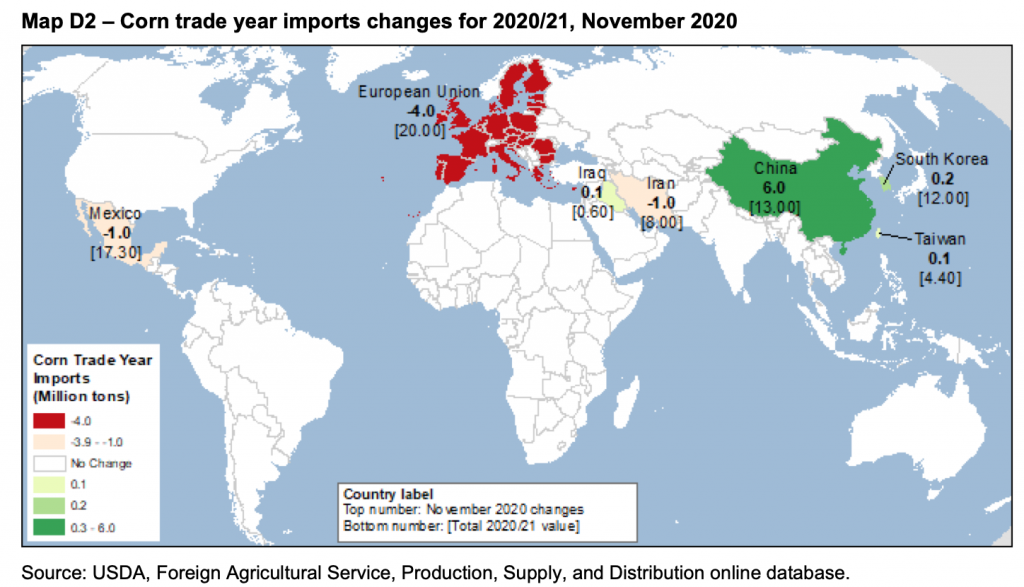
EU maize imports are expected to decrease by 4.0 million tonnes this month to 20.0 million tonnes. This is mainly due to a decrease in corn feed use. Indeed, the growth of the EU livestock sector is slow and the price of corn is high. The reduction in the corn feeding is expected to be partially compensated by the region’s use of more wheat and other coarse grains.
In Mexico, the use and imports of maize feed also decreased, down 1.0 million tons. This decrease is motivated by decreased demand for feed from its pork and beef sectors, where the recovery from the downturn in Covid-19 appears to be slower than expected.
The low speed of imports of Iranian maize (from Brazil and Ukraine) has led to a decrease of 1.0 million tons this month.
However, Chinese imports of corn have increased significantly to meet the growing demand for feed because its livestock inventories and production of meat increased.
ENDING STOCKS
Ending stocks are forecast at 2’167 million bushels, down 336 million bushels from the previous month. Declining global supply and increased U.S. exports more than compensating reductions in exports elsewhere are driving down ending stock.
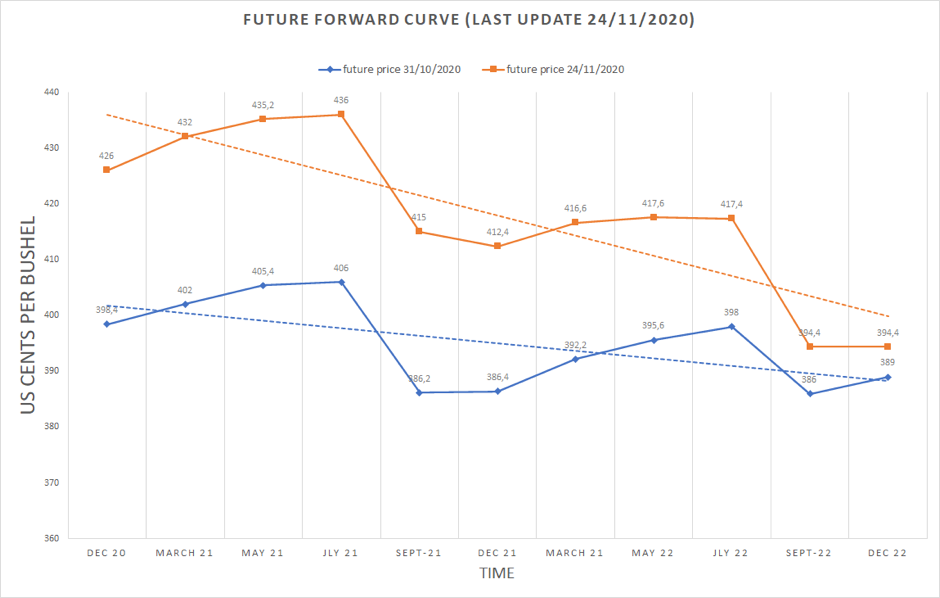
We can see that the forward curve has almost the same shape but the prices agreed on the 24th of November are higher than the price agreed on the 31th of October. The prices are higher because production decreased and export increased.
It is a normal curve (it is well supplied) from December to July (the message is to store) and goes into an inverse curve (the demand is hot) from July to December (the message is to deliver). This is due to seasonality.
RECOMMENDATION
As shown, production decreased this month and there is an increase in the demand from China. We can also add that the beginning stocks were lower as compared to the previous year.
Furthermore, the news of the vaccine for COVID-19 and the end of lockdown in some countries will reassure the economics agents and push them to be bullish.
We also find that the US plans to extend crop acre for next year, that will compensate for the drop in supply this year.
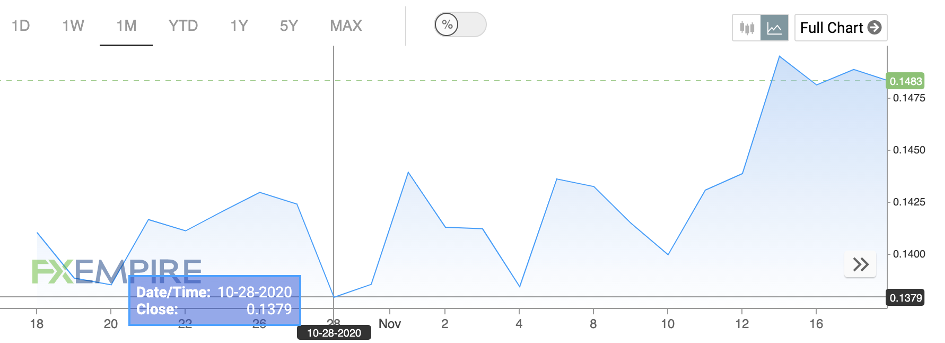
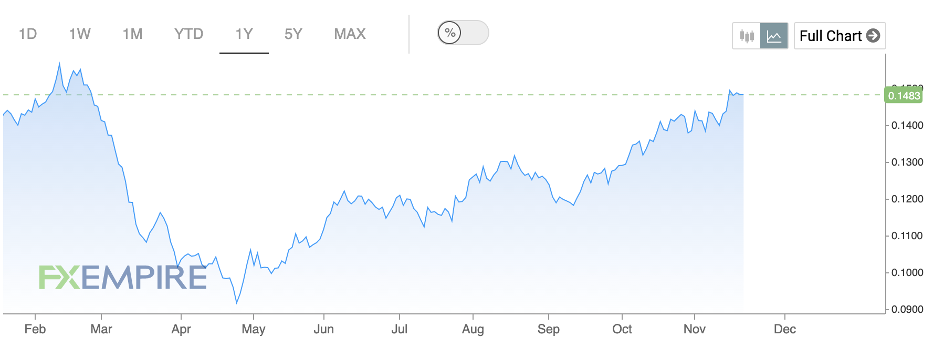
In order to make a small recap on the price, let’s remain the last price of the first bulletin. As we can see in the graph below, the 28th October the price was reaching 0.1379$ per pound. Today’s price is 0.1483$ per pound. We have forecasted that prices will fall down and comsumption as well. However, our predictions were wrong. In fact, prices tend to go up. But still we can see declines. Especially one decrease that can be explained by the US election on the 3rd November. In fact as we can see just after there is a substantial fall decrease. This is beacause of the market uncertanity due to the US election and also Trump’s reaction.
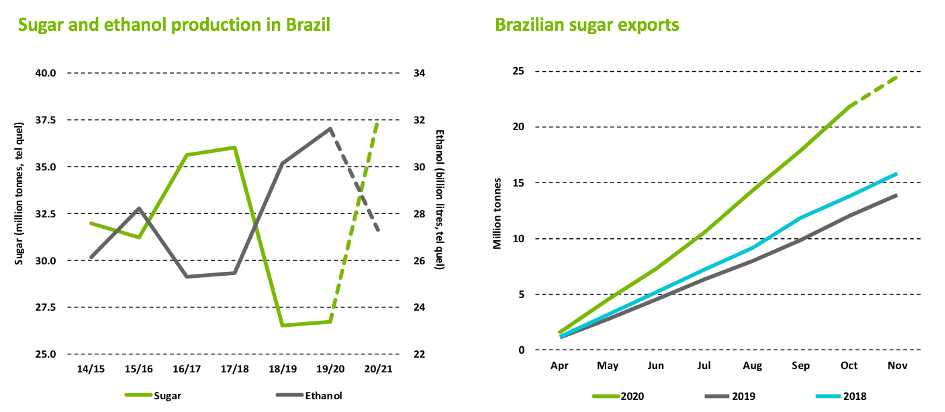
Brazil will increase sugar production by 11 million tonnes and exports will rise by slightly more than this. We can explain this important production by the fact that the economic crisis has had a very significant impact on the price of oil. In February, the price of oil fell to its lowest level since 2003. On November 19, the price of oil doubled since February, but it still remains relatively low.
The low price of oil has had a direct impact on sugar production. Becoming uncompetitive as a source of fuel, producers focused on sugar production, thus maintaining production at a high level.
Source : Point 3 NEW LMC_Prospects for the World Sugar Market_SMO 12 Nov 2020.ppt
Given that social and economic activities remain uncertain worldwide, this tendency of producers to focus on sugar production rather than ethanol production could continue for a few more months. For us, this trend can only change when the situation and the impact of COVID-19 is fully controlled by countries around the world.
Sugar price evolution in the coming months
For us, the price will continue to increase for various reasons:
Weather condition: On Tuesday 17th November, there was a storm that turned into a major hurricane which hit the central America. As we know, this region is known for being the main worldwide sugar producer. That is why, this is going to have an important impact on future sugar harvest and therefore on the price.
Situation in India: India is the second largest sugar producer. India’s food minister has said there will be no sugar export subsidies this year. According to some people, the lack of a subsidy could push the price up in the coming months as well. So, will Indian exports have a significant impact on the prices of the March 2021 ICE 11 contracts? (Bulletin 3?)
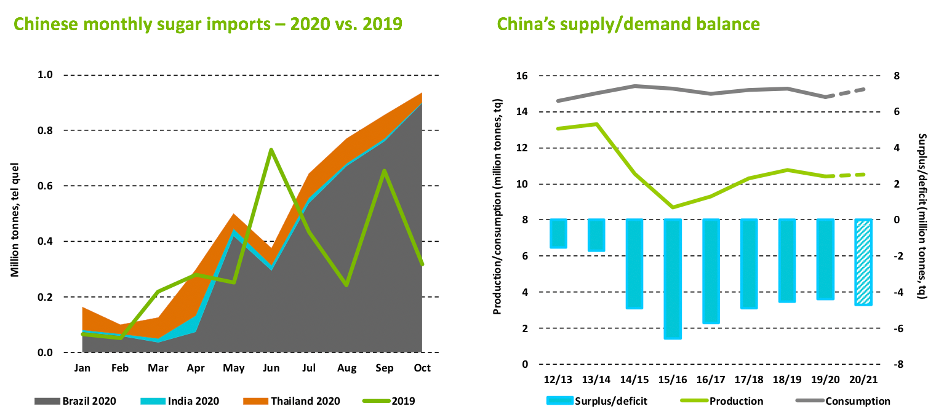
Lack of sugar: Currently, Brazil has sold all its production to China. As said before, its next harvest will be significantly reduced due to bad weather conditions. Also affected by the drought, Thailand’s sugar production should follow the same trend as Brazil’s production. In view of this situation, some producers might even turn to other crops that are more lucrative and less affected by external factors (e.g. soybean). The supply will therefore be less important for March 2021, which would explain the continuation of this upward price trend.
Source: Point 3 NEW LMC_Prospects for the World Sugar Market_SMO 12 Nov 2020.ppt
Recommendation
Previously, sugar production had increased, which had led to increased imports. This had an upward impact on the price of sugar. In the near future, we think that the prices will follow the seasonal pattern and continue to grow. However, due to the still uncertain situation regarding the COVID crisis and the consequences of the hurricane in Central America, prices have to be monitored on a daily basis in order to be protected against eventual inverse price movements.
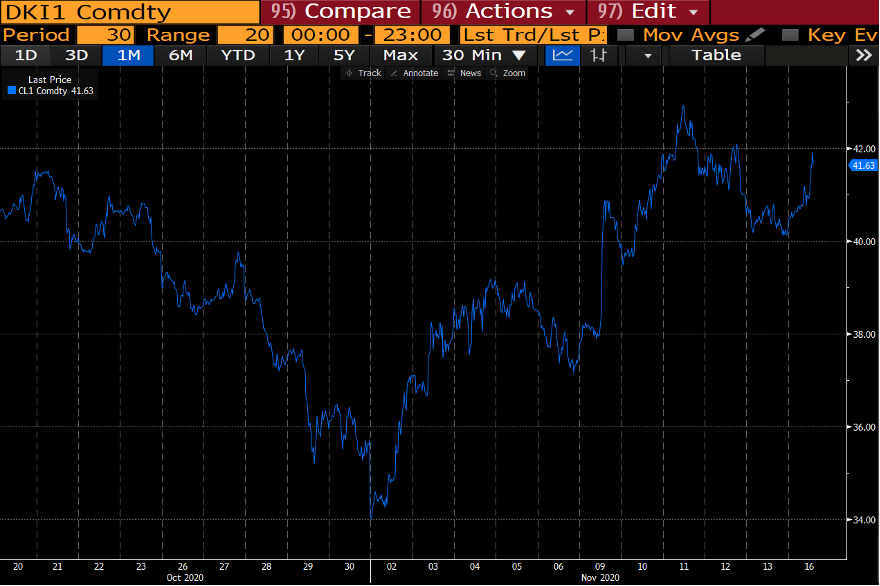
During the last 3 weeks, the oil price had first declined due to the lockdown announcements and political election uncertainties. Afterwards the oil price rebounded thanks to the Biden’s election (production in the US is expected to decrease + no more uncertainties on this election). Biden’s diplomacy is also a positive factor compared to Trump’s unpredictability. The optimistic outlook of 90% effective vaccines from Pfizer and 94.5% effective vaccines from Moderna allowe the market to rise, especially in the transport and energy (oil) sectors.
Futures prices / Cost Curves:
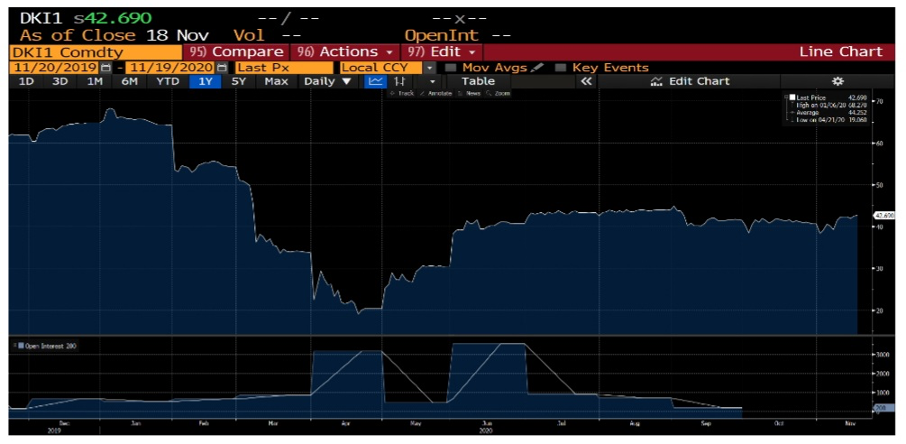
The Gulf Oil market is still in contango. Indeed, because of the Covid-19, supply remains higher than demand. However, if the vaccine developed by Pfizer and Biontech proves to be effective, we expect the price curve to flatten slightly in the coming months but still in contango. According to IEA (International Energy Agency), the Covid-19 vaccine is unlikely to raise oil prices until the end of 2021. A weaker demand outlook combined with rising supply is putting pressure on global producers to hold back output in order to support prices.
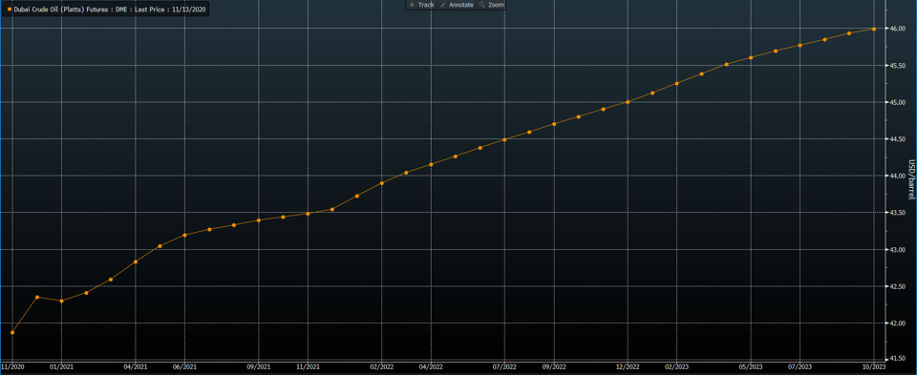
Dubai Crude – USD/barrel
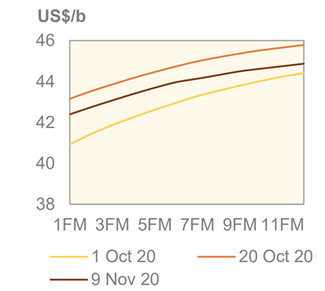
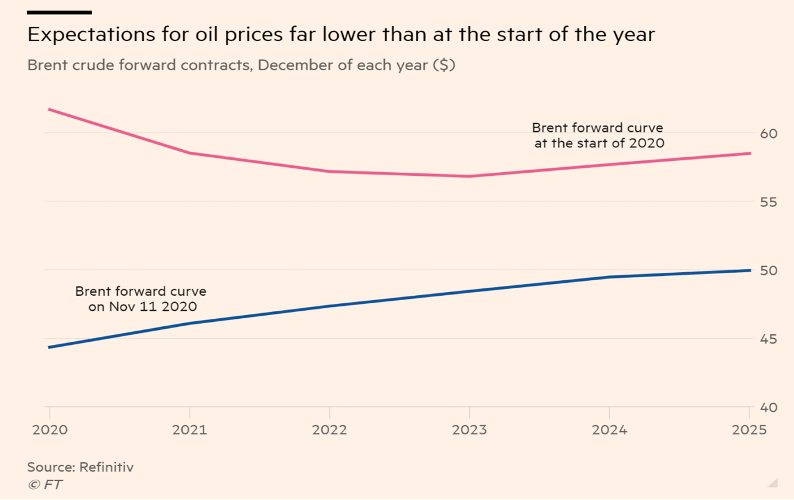
As explained above, the forecast for demand in the coming years is lower than it was at the beginning of the year. As shown in the chart below, this will necessarily impact the level of prices downward (supply > demand). We have used the Brent forward curve as there is not enough data on Dubai Crude. However, as the correlation between the different types of oil is very high, the scenario will be very similar for Gulf Oil.
Brent – USD/barrel
Supply and demand dynamic
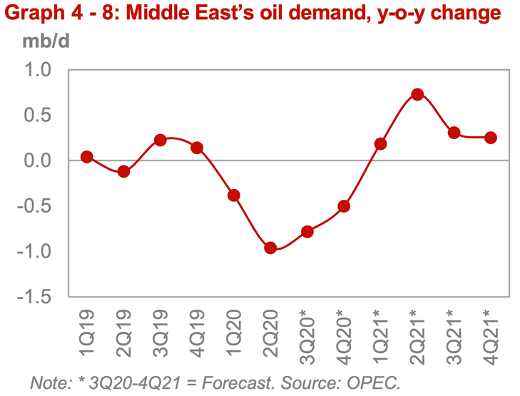
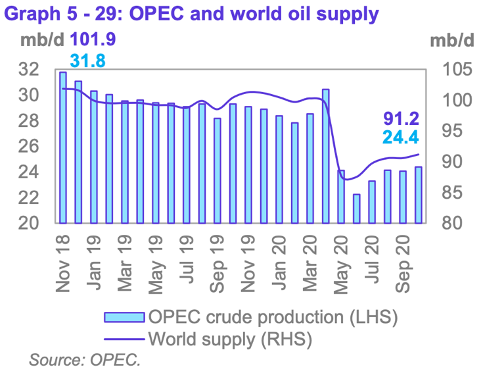
As we can see on graph 4, oil demand in the Middle East has not changed in the last 3 weeks. However, OPEC expects a decrease in demand for the end of 2020 and in 2021. Therefore, they will change their production plan as of January 2021. These changes are still due to Covid-19 and will last until mid-2021. Finally, we expect an upturn in demand thanks to optimistic forecasts of the Indian and Chinese economies.
Regarding the production, as shown in graph 5, it has slightly increased in September but is still very low compared to the same period in 2019. Finally, between the 30th November and 1st December OPEC members will meet the non-OPEC allies to discuss the production policy. The results of this meeting will also have an impact on price levels.
Recommendations
The market is still in contango and, from our point of view, will remain so for a long time. From an investment perspective, we still recommend to be long for the next 3 to 6 months. If the Covid-19 vaccine proves effective, this could have a significant impact on price level in the medium term with as the demand would pick up again, particularly in the field of transport and energy. Furthermore, we believe that the current price does not reflect the potential for recovery in the transport sector otherwise the price would have been higher.
MILLER, Joe, MANCINI, Donato Paolo and KUCHLER, Hannah, 2020. BioNTech and Pfizer raise hopes with breakthrough Covid-19 vaccine. [online]. 9 November 2020. [Viewed 15 November 2020]. Available from: https://www.ft.com/content/497594f4-7771-4af5-98dc-8c98487ea212
Moderna: Covid vaccine shows nearly 95% protection, 2020. BBC News [online]. [Viewed 16 November 2020]. Available from: https://www.bbc.com/news/health-54902908
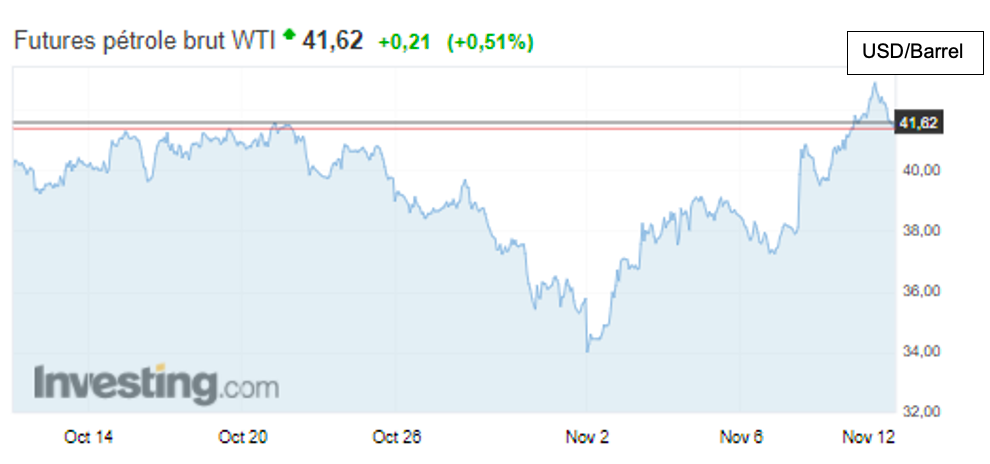
WTI USD | Cours du pétrole brut WTI Dollar américain | Cours Cours du pétrole brut WTI Dollar américain, [no date]. Investing.com France [online]. [Viewed 17 November 2020]. Available from: https://fr.investing.com/currencies/wti-usd
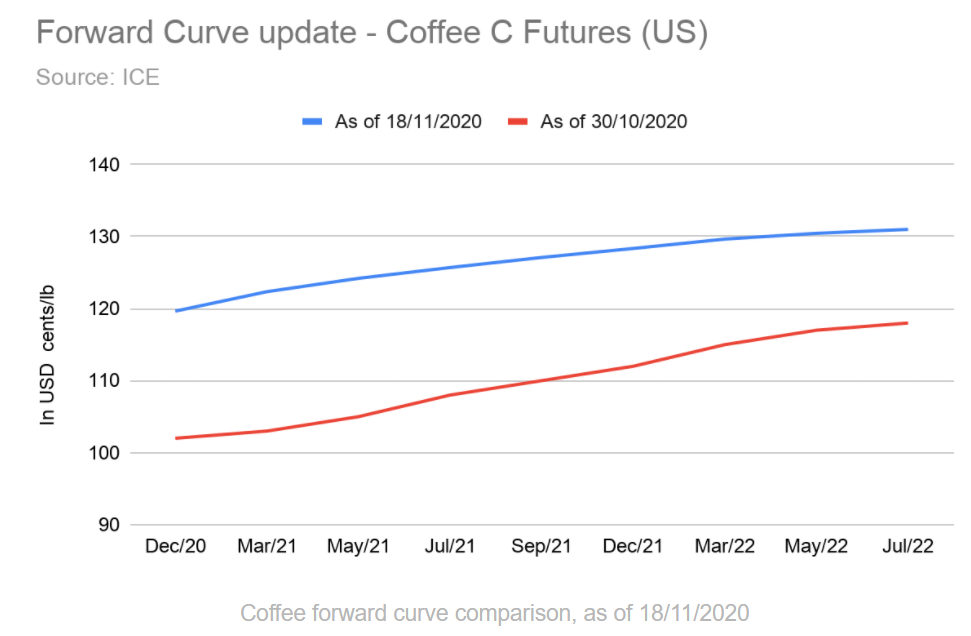
The coffee forward curve has significantly moved since the last bulletin. Indeed the price of the near term contract (DEC-20) has jumped from 102 to 119.65 cents/pound. This jump also affects the following contract, with an increase for JUL-22, from 118 to 131. This increase is believed to be due to diminished exports confirmed by the latest release of ICO report as well as increased demand from recovering economy. (ICO, 2020)
Besides, it is noticeable that the forward-curve has flattened a bit. Thus, indicating growth in immediate demand as the premium for late delivery decreases.
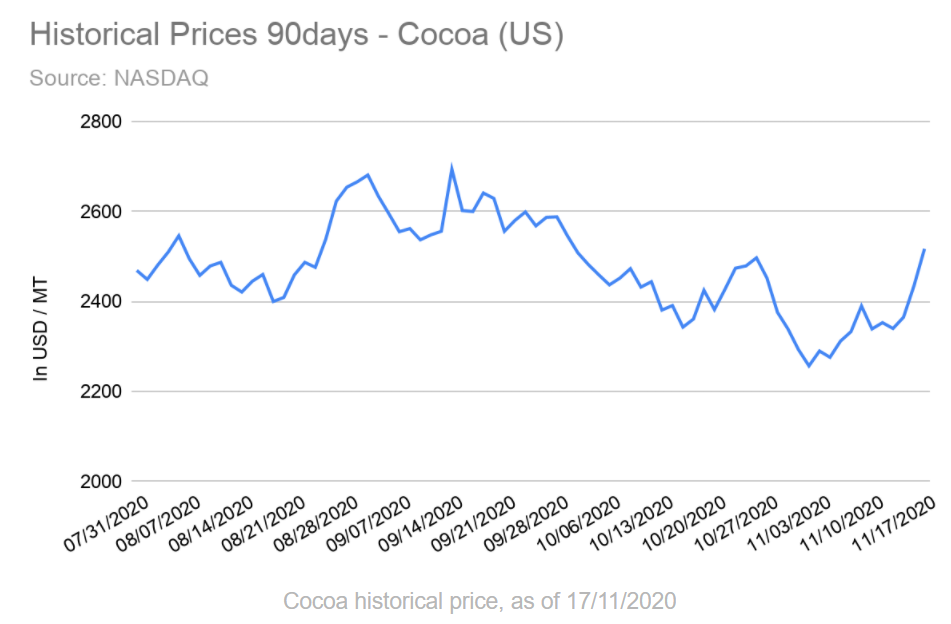
Cocoa
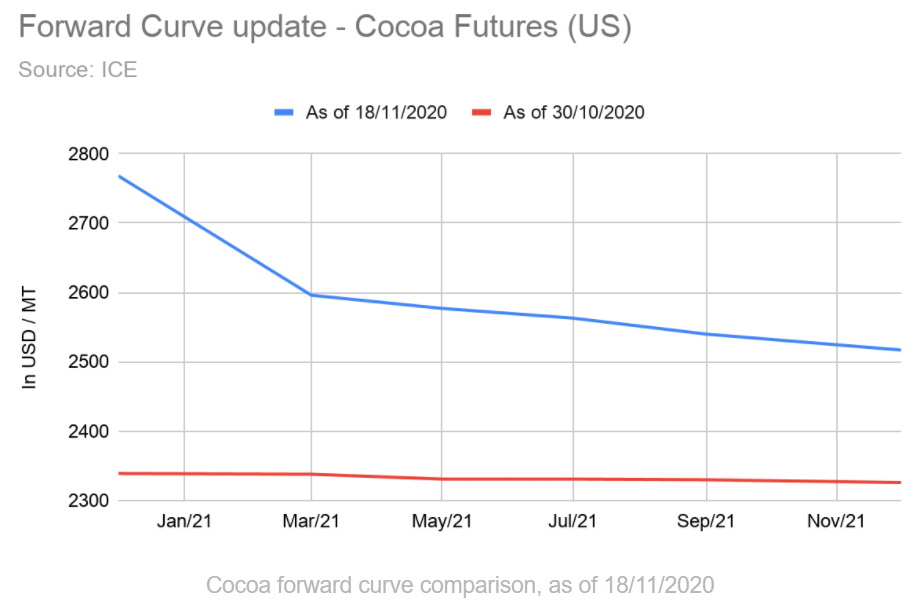
With regards to Cocoa forward curve, its shape has widely changed. It is now in a clear contango. The seasonality is probably in play here, paying a premium for immediate delivery of the recent 2020/2021 season harvest in November 2020.
Also, the overall price has increased. It can be related to the increase of farm-gate prices, decreed by Ghana and Côte d’Ivoire, as well as international recovery, knowing that exports are within predictions. (ICCO, 2020)
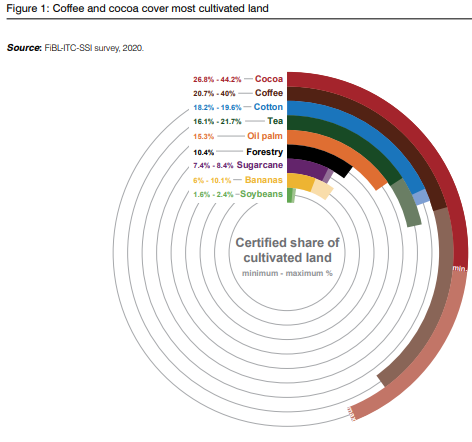
VSS-compliant Coffee and Cocoa
The International Trade Center recently published a report (2020) about sustainable commodities. This document highlights the increase in these last couple of years (2014-2018) of sustainably certified crop fields for several commodities including cocoa. According to the report, the demand for VSS-compliant cocoa (Voluntary sustainability standard) is rising especially in North America and Western Europe. This demand mainly comes from the desire of consumers to buy more ethical chocolate. The experts expect this trend to continue (+9.5% CAGR) until 2025 and to reach USD 620M in retail value by 2025.
Moreover, the ITC report states about Asia, to become in a not so far future “the world’s second-largest consumer market of cocoa-based ingredients” right behind Western Europe. This is bringing concerns about the capability of cocoa producers to meet the demand. Indeed, climate change and the low-yield of farmers are threatening the production of the commodity.
However, coffee is an exception to that. This commodity has seen a decrease in the estimation of the minimum area VSS certified between 2014-2018. The compliant areas decreased by 12.2% in the same given time (20.7% of global production area). This can be partially explained by the oversupply of VSS-compliant products. Research suggests the consumers in emerging economies are more price-sensitive than expected. So, the premium price of VSS-compliant coffee reduces product attractiveness. Nevertheless, data shows the demand for sustainable coffee is still growing (ITC, 2020).
Recommendation
Coffee
The latest results published by ICO are pushing the prices higher. The lower exports combined with the overall economic situation are impacting the short term. It is still expected that next season would hit record numbers. Therefore, we still remind cautious with coffee, as the price might soon come back to the lower tier.
Cocoa
The supply chain is impacted by the increase in farm-gate price. This premium will be mostly absorbed by intermediaries along the way. It still increases the price as production remains stable. The next report from ICCO concerning the harvest of November 2020 will provide more guidance with regards to the supply side. Therefore, we continue our forecast for a stable price of 2300-2500 USD/Ton.
Disclaimer
This publication is for your information only and is not intended as an offer, or a solicitation of an offer, to buy or sell any investment or other specific product. The analysis contained herein does not constitute a personal recommendation or take into account the particular investment objectives, investment strategies, financial situation and needs of any specific recipient. It is based on numerous assumptions
The International Trade Centre. The State Of Sustainable Markets 2020. The International Trade Centre, Geneva, 2020, https://www.intracen.org/uploadedFiles/intracenorg/Content/Publications/SustainableMarkets2020-layout_20201012_web.pdf. Accessed 18 Nov 2020.
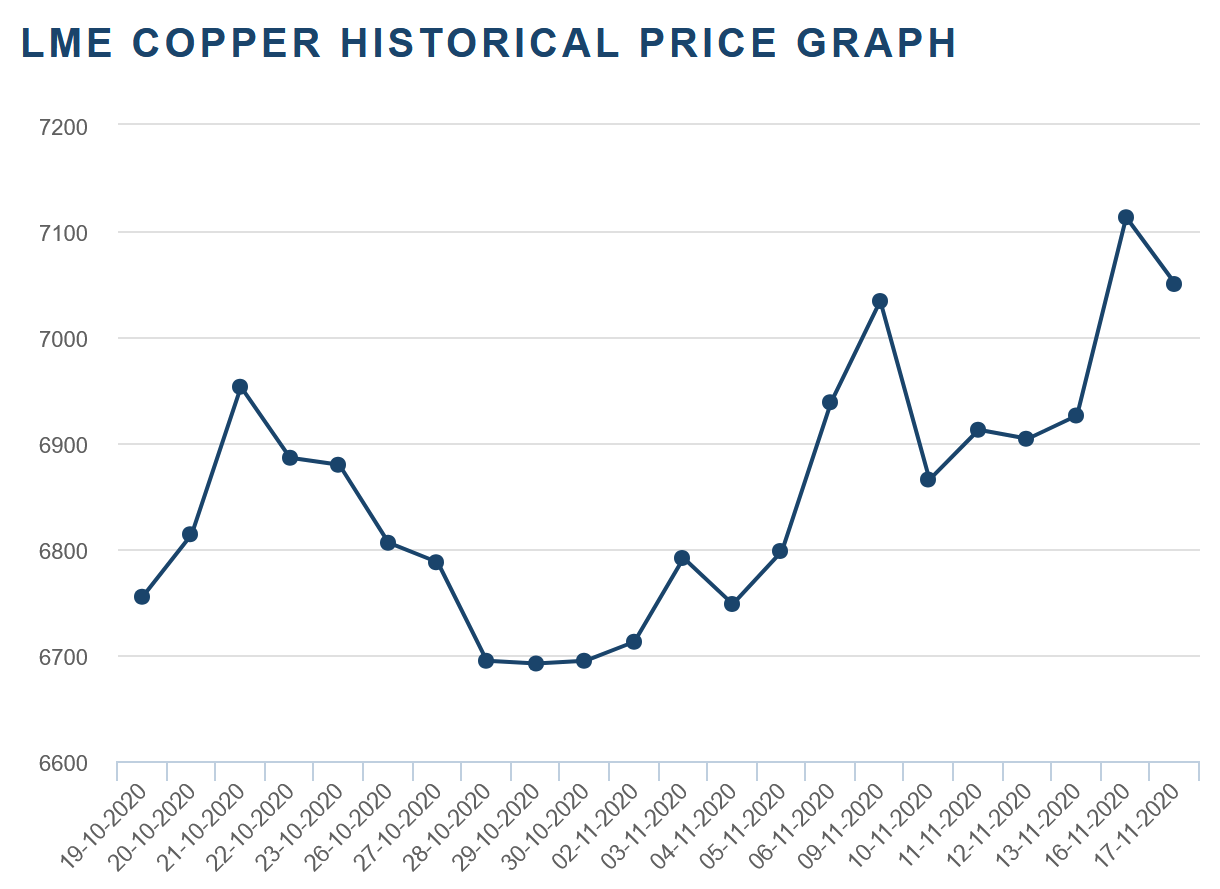
This graphic shows a certain level of volatility in the price for copper. It can be explained by the following:
The US elections have caused a certain political instability in the country which has led to a decrease of the US Dollar value. This decrease in the dollar has led to a decrease of the perceived price of copper since the commodity is mainly traded in US Dollars. Then come ups and downs showing the volatility of the US Dollar following Joe Biden’s victory and Donald Trump’s non-acceptance of this outcome.
Following the final outcome of the elections, the US Dollar has more or less stabilized but will still remain volatile as long as Donald Trump will not accept the US election results. This impacts the value of the dollar, and thus the perceived price of copper.
From a demand and supply perspective, however, demand is still in slight increase following the recovery post-first-covid-wave and supply is “late” compared to last year’s results with a 2.1% decrease in 2020 due to measures taken to decrease the spread of the virus in producing countries. However, supply is expected to catch up quickly and get back to usual levels (expectation to be shown in the forward curve below).
The graphic shows that the forward curve on the 18.11.2020 is clearly different from the one on the 29.10.2020. Since all the prices of the forwards got higher we can estimate that the market is doing better than expected. From December 2020 to February 2021, we have a contango which means that the market is expected to be well supplied for that period, followed by a small backwardation for the month of march, then the market has a contango up until December. We can conclude from that the view of the market as of today over the next year is pretty good, because the market is mostly contango which means an estimated good supply of the market over the next year.
Compared to the 29.10.2020 forwards, the period between November and January is no longer a backwardation but a contango, which means that the market view on the 18.11.2020 changed for a good supply over the next months. This can be related to the vaccine announcements made by Pfizer and Moderna.
It’s also related to the clarity over the situation of the USA, since now we have the results of the election, the dollar got stronger and more stable.
The fact that Joe Biden is elected as a president can explain the contango over the next year, that can be explained by a more stable political situation, specially with China.
ILLUSTRATION OF SUPPLY AND DEMAND / INVENTORY LEVELS
As explained in the last bulletin for copper, the stock of copper got higher due to the continuity in production and mining in the producing countries during the first wave of COVID-19. The stock from the 29.10.2020 and today dropped slowly but it doesn’t affect the market. As said before, the demand of copper is slightly increasing following the recovery after the first wave of COVID-19; yet the supply didn’t fully recover after a slow delay gained after the first wave of the virus which explains the small drop in copper inventories.
Because China is a big consumer of copper and didn’t suffer from a second wave of COVID-19, their production (and consequent need for copper) remained stable during this second wave that hit Europe and the US.
Yet this situation isn’t a sign of shortage on the market, it can be explained by a transitioning period.
Nevertheless, the price of copper is hugely impacted by the dollar stability that can explain why the stock got down a little since the dollar got weaker during the election period which might have encouraged the buy of copper.
RECOMMENDATIONS
We have a contango up until February, we advise for a strong buy in this period, to sell from February to March since we have a small backwardation, and buy in March since the year is going through a contango. We also advise buying strongly due to COVID-19 evolution many countries will start or have started already the mass vaccination which will help the economy to recover. Since copper is highly correlated with the economic activity we recommend a strong buy now.
— By Ismail MODAFFAR IDRISSI, Tashi JARON and Amélia REUSSER
The Liquefied Natural Gas market is highly correlated with Natural Gas market trends and prices. Indeed, LNG is just NG but in a liquefied state. In other words, the amount of natural gas production, the amount of gas in storage and the volumes of imports/exports mean a great deal on the LNG global market.
Natural gas price that consumers pay is set based on two main components, which include various taxes and fees. First, you have the commodity cost itself either when it is produced or purchased. The second component are the transmission and distribution costs to move the natural gas by pipeline local natural gas distribution utilities and the cost of delivery to consumers. The shares of these two cost components vary according to natural gas market conditions.
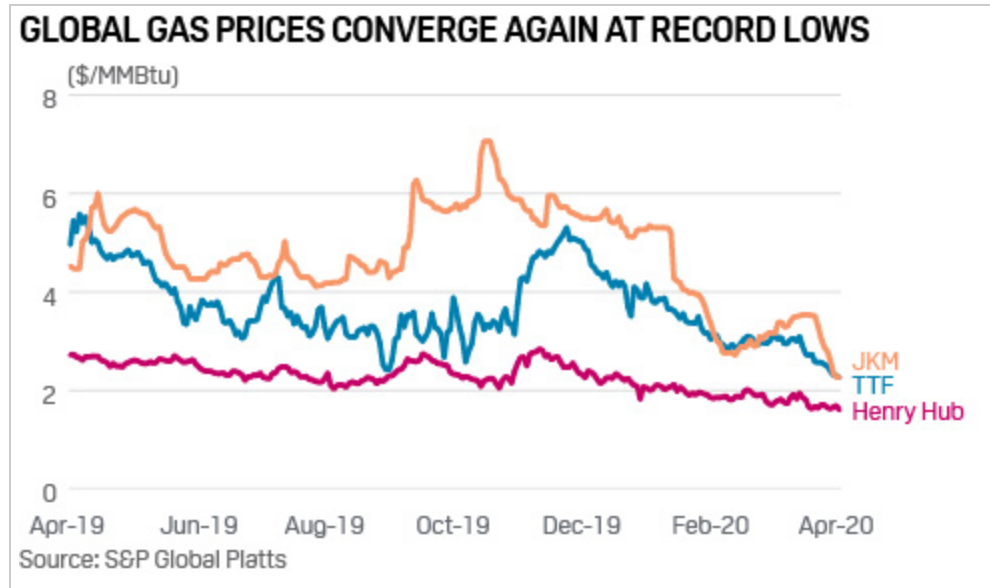
In this graph, we can observe three different price indexes:
JKM™ reflects the spot market value of cargoes delivered ex-ship (DES) into Japan, South Korea, China and Taiwan. Deliveries into these locations equate to the majority of global LNG demand.
The TTF (The Title Transfer Facility) Netherland price index is linked to the huge Groningen onshore gas field which is the center of a large pipeline network.
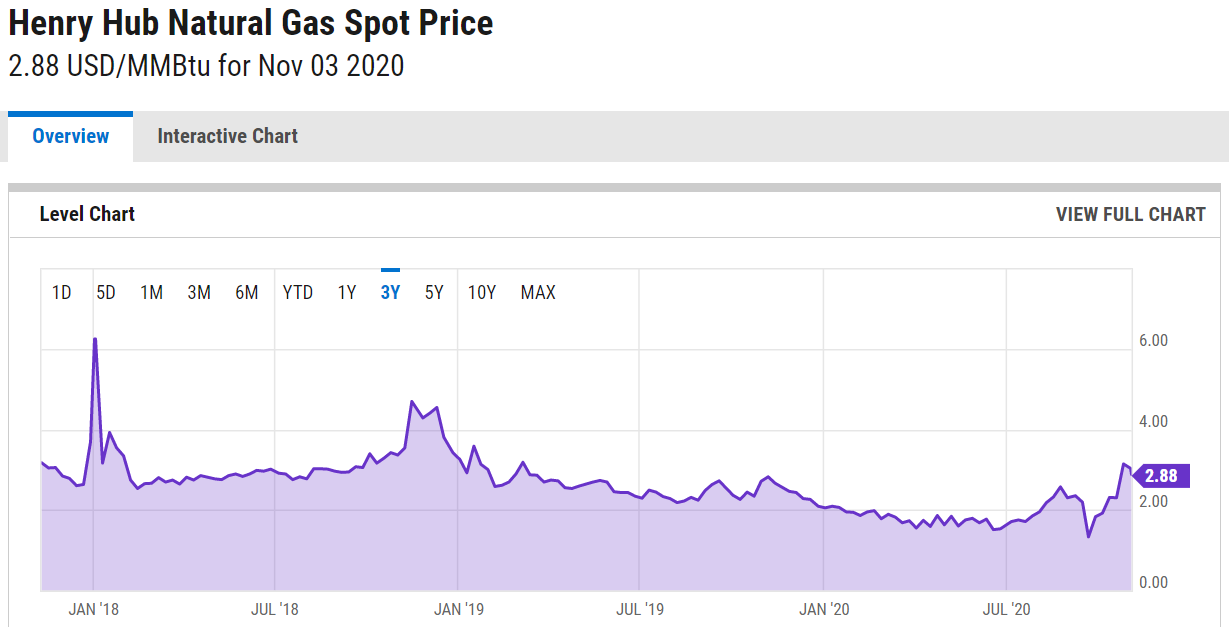
The Henry Hub price index is the US benchmark for natural gas and considered as the biggest natural gas hub.
Observation:
The JKM price refers to Japan Korea Marker, these countries are the main importers of LNG as they don’t have access to pipeline facilities. By definition, this price index is more expensive because it includes transportation costs from export countries (Australia and Qatar) highly correlated with the oil benchmark. We can observe that the two price indexes (JKM and TTF) are more volatile than the Henry Hub one.
That is to say, these indexes are linked to the seasonality and way more impacted by demand. As they are not producers, prices are not that steady throughout the year. The U.S. are big producers and exporters. Their production is close to being linear and as they export all over the world, the demand for their own LNG production does not vary that much, hence the more stable prices. Even if they have an excess of production, they can easily store it under a liquid state of matter (LNG storage facilities) or gas under depleted natural reservoirs.
We can observe on this graph the price evolution of Natural gas spots since 2018. We have to highlight the fact due to this overall unstable economic situation established with Covid pandemy, NG and LNG prices drastically decreased and reached a lowest price record achieved.
Forward Curve:
A therm (thm) equals 100’000 British thermal units (Btu).
There are many factors that can affect oil and gas prices. Some of these include the changing dynamics of supply and demand, the amount and cost of storage available, changes in interest rates, fluctuations in foreign exchange rates, the marginal cost of supply, assessment of geopolitical risk and supply shock and the market opinion and expectation and many more influences.
In this case, futures are highly dependent on seasonality of demand and result in a curve that is neither a contango or a backwardation curve but a mix of both depending on the period. We can see that the incentive in January 2021 will be to sell as much as possible whereas in August 2021, the market is telling producers to store.
Supply & Demand:
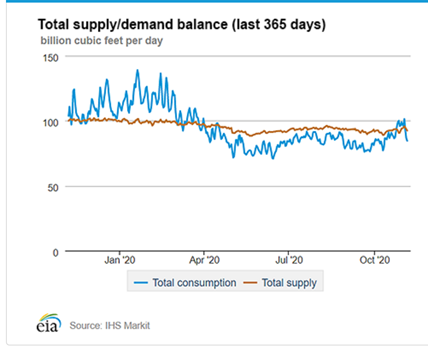
Daily supply/demand on the US market
LNG companies have been forced due to Covid19 to look for short-term contracts as securing long-term supply contracts have become a challenge. Moreover, the instability of the current economic scenario is causing LNG companies to think twice before making investment decisions. Thus, the overall situation impacted project financing and resulted in financial investment delays of several projects. Furthermore, by analyzing the graph thoroughly we understand that the level of supply is not manageable in the short term as LNG requires huge plants to be produced/extracted even though the pandemic has slowed production a bit.
Main factors of supply:
Actual production
Inventory storage
Import/Export
Main factors of demand:
Weather
Government policy/regulation
Petrol prices
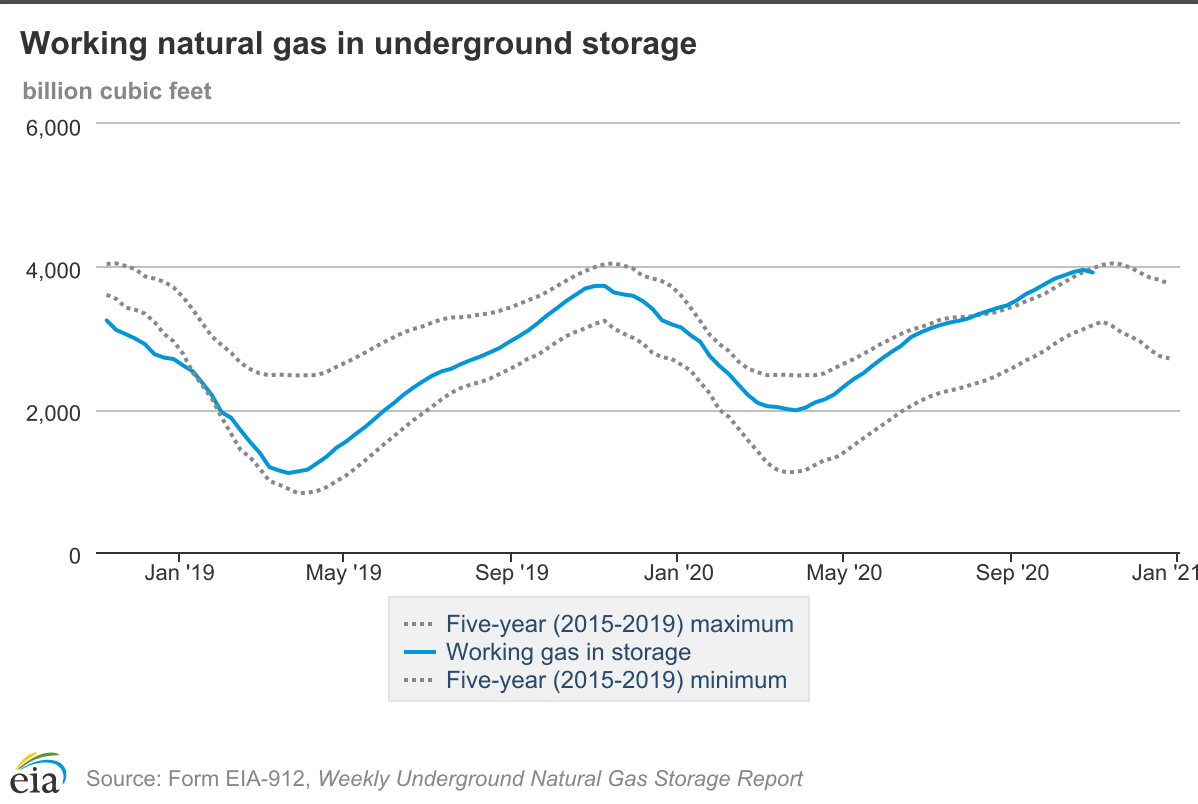
Inventory levels:
The graph above can illustrate the strategy of production and extraction of the US. Indeed, we can see that during the flat period of consumption of LNG and NG which appears during summer (April-October), they are storing the majority of their production in order to fulfil the demand beginning of the winter.
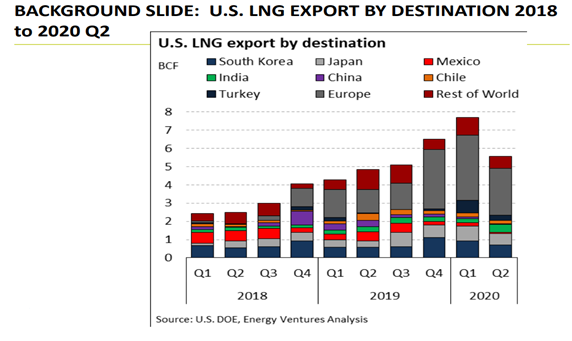
U.S. LNG Export:
The graph above represents the U.S LNG export from 2018 to 2020 Q2. We can observe that the U.S export of LNG over the year drastically increases in overall. Even though Japan is the world’s biggest importer of LNG accounting with 20% of the global consumption, we can see that South Korea is the main purchaser in the United states, South Korea were making massive effort of consuming cleaner energy (however they have long-planned nuclear and coal plants projects in the coming years-> consumption of LNG is expected to decrease over time). We can see that Korea is closely followed by Japan which uses LNG to generate nearly 40% of its power. Between Q1 and Q2 in 2020 we can see the massive drop for the U.S export globally due to the COVID-19 breakdown combined with a warmer winter affect the demand of LNG.
According to the NGSA, there are mainly 5 types of market pressure point that can influence the price of Natural Gas and thus LNG. Economy, Weather, Demand, Production, Storage are variables that have influence on market pressure. For this winter the forecast on average predict a upward market pressure in the U.S due to the following factors:
Economy: is a vital factor that influences the LNG market. For the current year, the GDP is expected to decline to -2.6 percent. Which will have a downward pressure.
Weather: The National Oceanic and Atmospheric Administration predicted an average winter 4 percent colder than last winter in the United states. This factor will affect consumption and put an upward pressure on the market.
Demand: Customer demand forecast an average 109.5 Bcf/day in 2020/2021 compared with 2019/2020 with an average of 110.6 Bcf/day . In global this will have a neutral pressure on the market.
Supply: NGSA, expected the production to decrease by substantial 9 percent. This will result in a higher price due to the fact that there is a lower supply with a constant demand.
Storage: The start of winter inventory is forecast to be 9 percent above the 5-year average with just over 4 Tcf of gas in storage, considerably more than last winter’s 3.7 Bcf levels. Higher capacity storage will result in a downward pressure on the market in the U.S.
Recommendation:
Since for this coming winter market is expected to go in backwardation with the analysis made by NGSA, we recommend to sell now and do not store the commodity. Furthermore, as we are in the second wave of the COVID-19 LNG market is becoming uncertain as every commodity we can only plan for the coming month.
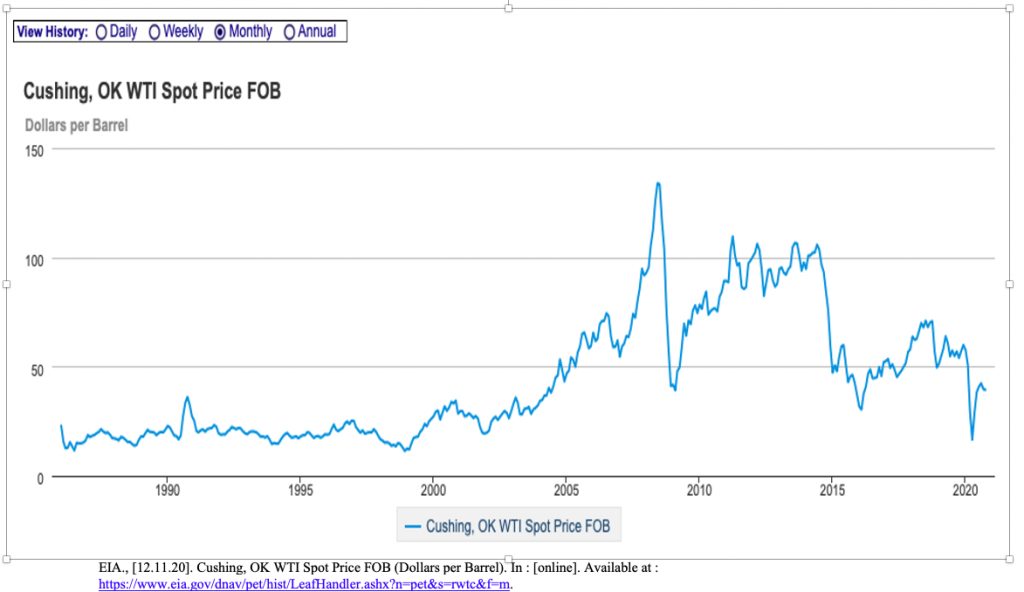
2014-2016 economic slow-down, and massive oversupply of oil by NON-OPEC countries essentially due to rising shale oil production by the US, combined with economic slow-down reducing demand for oil. Causing decrease in WTI spot price from USD105/barrel to USD36/barrel. [1]
2020 Coronavirus recession: economic slow-down reducing transport, air-traffic, affecting directly the global demand for oil which caused the price to fall drastically and for the first time, WTI trading to negative USD37/barrel. Agreement from OPEC+ to cut output by 10M barrels/day, allowed a recovery to come back positive and more or less stabilizing the price oil. [2]
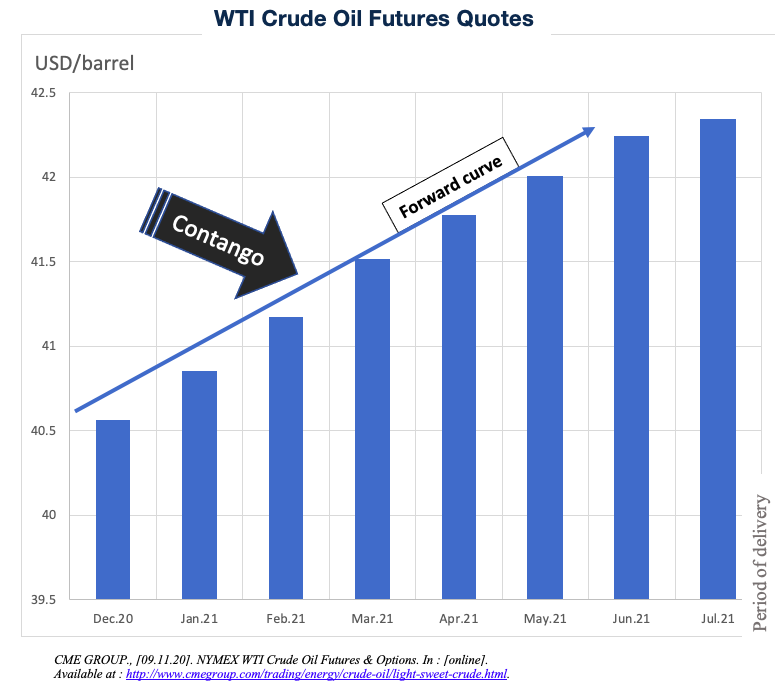
Forward curve 9.11.20
In this case the forward curve is in contango which means the spot price for delivery now is lower than today’s price for delivery in future. In other words, it means our market is relatively well supplied. Supply is greater than demand now,
In other words, today’s future contract prices for delivery today is lower than prices for delivery in future.This can be explained by the fact thattoday’s prices for future delivery include: Storage and finance cost.
The contango situation could be explained by the recent cut in oil production from OPEC+ and also the short recovery of the economy by the expected announcement of a potential vaccine. [2]
Supply and demand dynamic – Inventory levels [3]
Oil changed due to its fundamentals[3]
30th October: Oil rigs increase by 10 in the US. It’s used to happen when the market is doing well. OPEC increased its supply by releasing its weekly production per member[3]
3rd November: American Petroleum Institute announced for Inventory level a large drawdown of 8millions barrels. This lack in supply makes price increase[3]
4th November: Energy Information Administration’s weekly crude oil inventory announced another drawdown of 8milions barrels. [3]
Election in the US affect the oil market because of different points of view between Trump and Biden. Trump supports the current oil production and Joe Biden wants to invest USD2 trillion in green energy which doesn’t help the oil market. Politics and coronavirus created uncertainty because people don’t know if there’ll have a vaccine or lockdown. [3]
Recommendations:
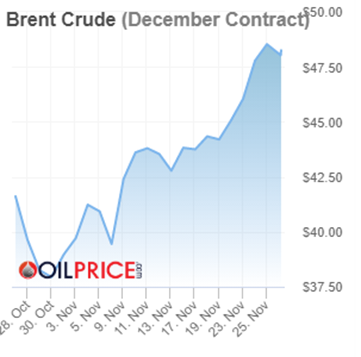
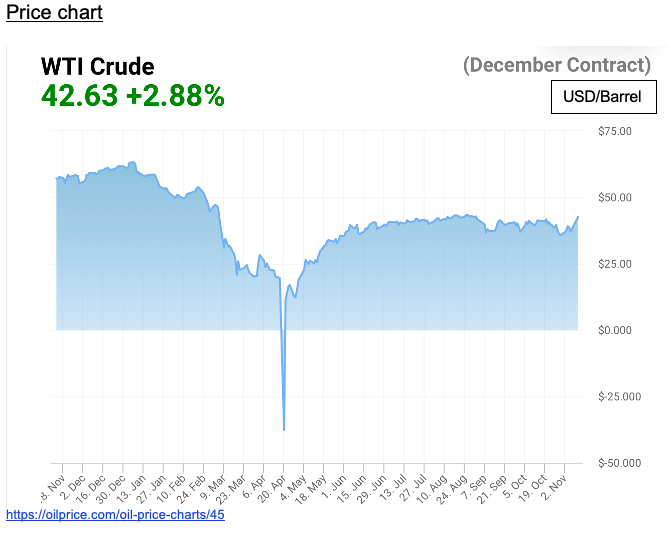
On Monday, oil prices increased after the announcement of a vaccine effective at more than 90% against the coronavirus by Pfizer. With markets looking forward to the potential end of the pandemic sometime next year, optimism returned in a big way. We can already see that crude oil had its best day in months, rising more than 10%. The growth has contributed to significant increases in the share prices of many oil companies. [5]
Even though, compared to early November where the price was at $37.14 and now raising to $42.59 per barrel (price today for delivery in december) the recommendation is to be long (buy) for the next 3-6 months. Since with the announcement of the vaccine the future consumption of oil will tend to rise and the market being well supplied will be contango and therefore meaning that the price will be higher month after month in a year’s time to reach maybe the prices of last year. (Nov 2019 $57.03 and Jan 2019 $63.12). [5]