
Wheat procurement may rise 10 pc at 427 lakh tonnes in 2021-22 marketing year
Crop Insurance Guarantees Soar – (Corn)
Bulletin #1 – Is the covid-19 really having an effect on the wheat market ?
By Lyticia Wouguia, Christopher Delfin and Piratharsan Poologanathan
Price movement recap
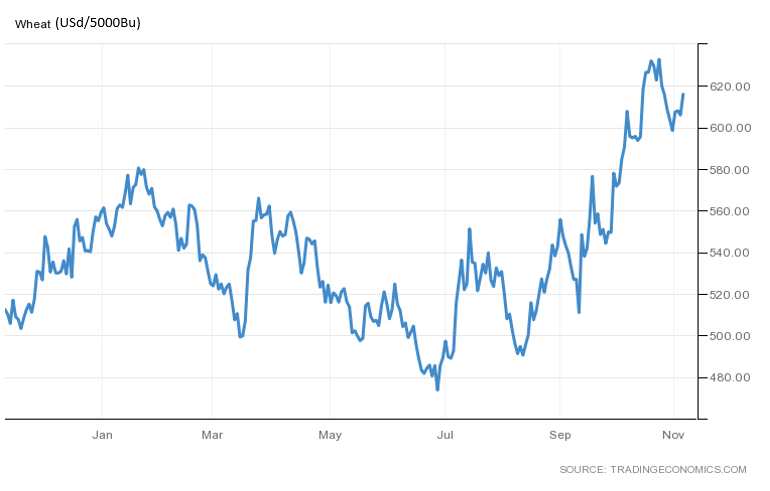
The graph above represents wheat prices of the year 2020. To begin with, due to the outbreak of COVID-19, some major commodities have been highly affected. However, wheat has seen minimal direct impact from this pandemic. This is because wheat has a relatively stable demand and is considered one of the most inelastic commodities. But, by looking at the first part of the pandemic outbreak (Feb-April), prices are dropping continuously due to disruptions in demand from the worldwide lockdown. Meaning also that there are less exports and less production happening. Then, there is a peak by mid-March which is due to new harvests from farmers. Furthermore, coming at the end of the year, prices are rising as there is a continued reduction in production in the EU and the Black Sea due to scorching weather and this is a big risk for tighter supplies in those nations that dominate the international export market.
Supply & demand
By reaching the end of the year, USDA forecast world wheat production at 768.48 MT in 2020-21. A difference of 4.17 MT from 764.32 MT in 2019-20 which is the current record. Overall, the EU, Ukraine and the United States will be producing and export less as they will be facing unfavorable weather conditions. Meanwhile, Argentina, Australia and Canada and some Asian Countries will have better performances as exporters.
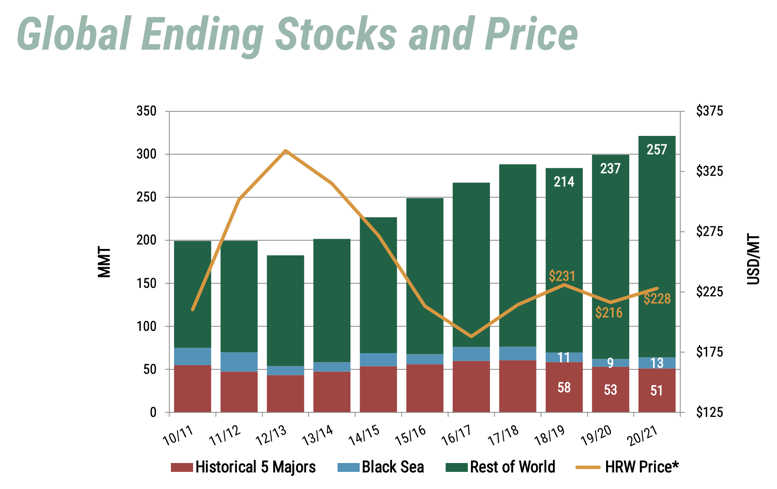
In addition, due to the second wave of the virus, countries are focusing more on domestic consumption rather than foreign trade, which also increases their own wheat stocks. As seen below, world ending stocks is at 321MT and half of these stocks is held by China, around 163MT. Regarding the influence of the Covid-19 pandemic and the panic buying of long-term storage food products, such as pasta, has not greatly affected the demand curve worldwide. It has only affected local demand at small fluctuation.
Here below is a graph:

Global ending stock has a major effect on the supply. As you can see on the graph below, the ending stock is increasing each year. This increase is explained by the fact that China and India have increased their stock due to the government’s encouragement through subsidiaries. However, as we can see on the graph the price tends to increase, because China and India do not export wheat.
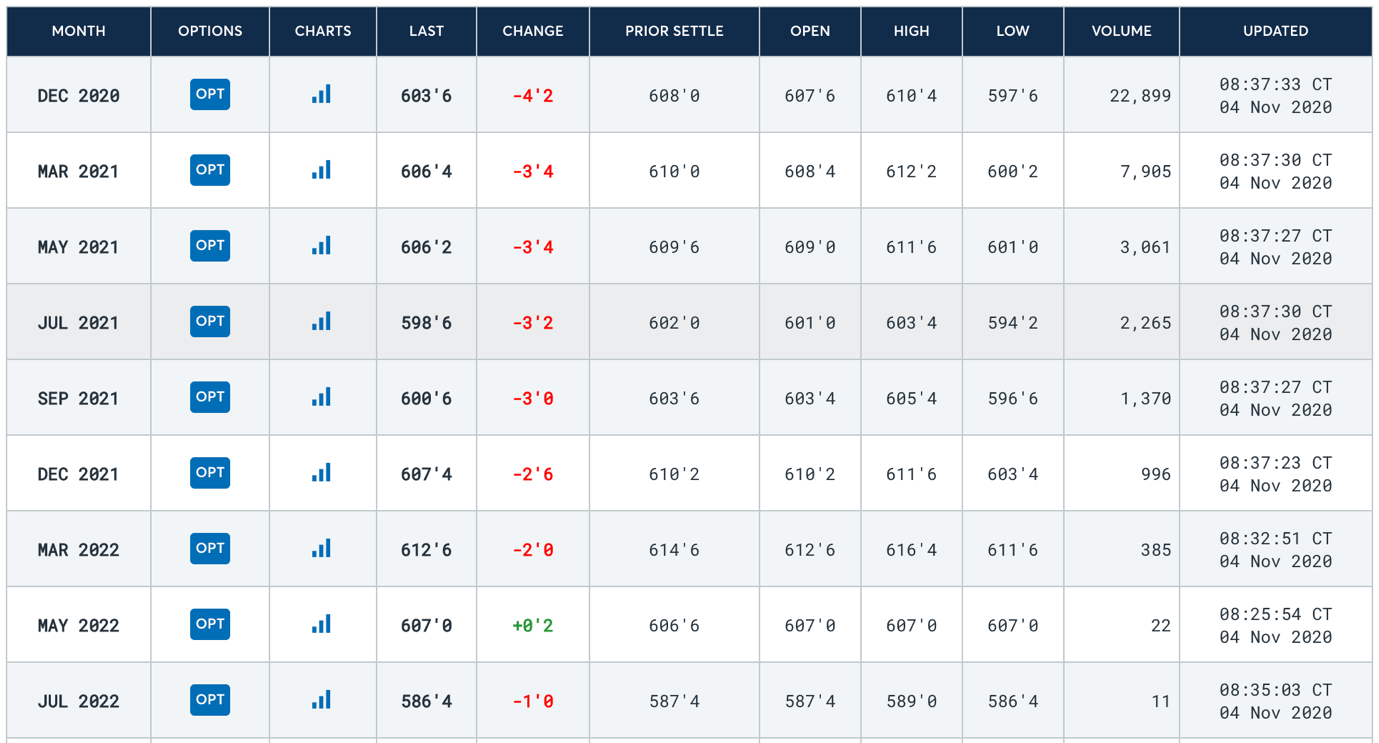
Chicago SRW Wheat Futures Quotes
The Chicago soft red wheat, which is the largest wheat derivative, the futures are above the spot price. We can observe that today the market is not supposed to lack in production, and it will stick to the growing demand.
Recommendations
Due to the seasonality that the wheat market depends on, the price varies a lot on the harvest period or. Actually, we are facing here, a normal curve from December to March, and then the price stays stable till May and finally decrease. This cycle seems to repeat itself on year 2021 and 2022. In an investment perspective for the next 3 months, it is in the best interest to store.
Sources
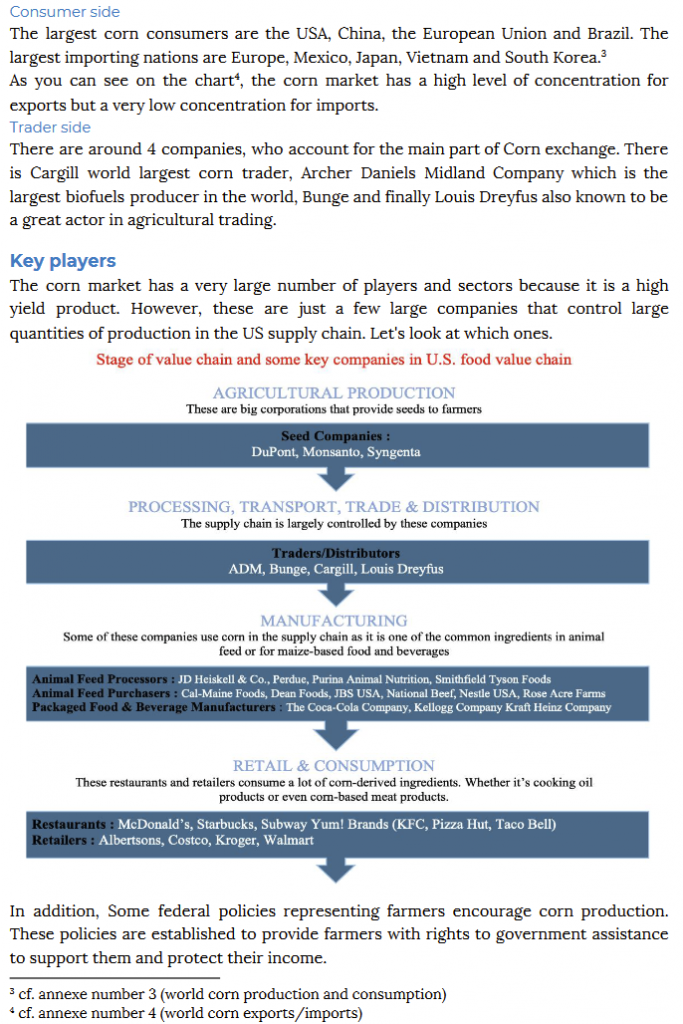
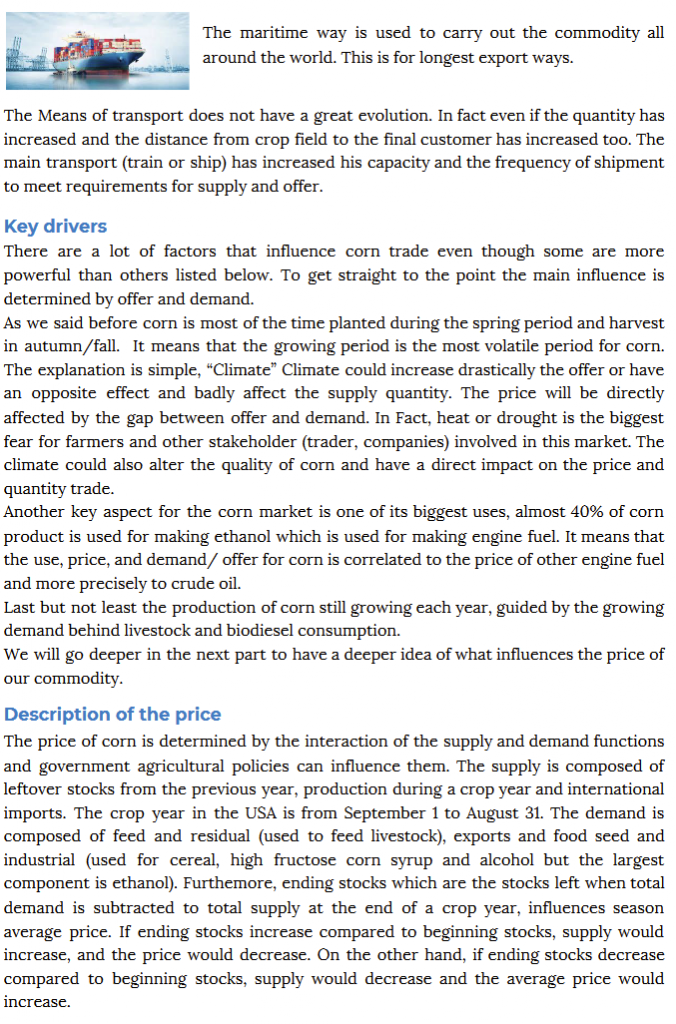
Market overview – Corn 2020


Soybeans – 2nd semester, bulletin #1
End of 2018 was disastrous for big trading houses, what about 2019 with the U.S. / China trade war ?
Trade news
Trade-war between the USA and China deeply impacted agribusinesses as all of the ABCD recorded a loss during the fourth quarter of 2018. For instance, AMD net income dropped by $315 millions, Bunge has suffered a $125 millions mark-to-market loss, Cargill reported a 20% fiscal profit drop and Louis Dreyfus sustained a $65 millions mark-to-market loss on oilseeds hedging.
These impressive loss are mostly due to tariffs imposed on each other by the rival nations. China, in response, turned to Brazil for its soybean and grain traders, ABCD’s, jumped at the chance to ship them from South America, resulting in a price increase. However, as tensions eased, price for Brazilian soy returned to its normal state and most trading companies lost money on their hedging operations.
For the current year, the US Department of Agriculture forecast an increase in unsold crop from 13.5 millions tons, stocked, by the end of 2018, to 25 millions tons. This huge setback in sale will mostly impact farmers as Financial Times estimates the 2018 loss to almost 8 billions dollars.
Price movement

(Prices expressed in USD$ per bushel)
Soybean prices keep falling as traders wait for improvements in US / China trade war. March futures fell 11.5 cents to move back, closing at 8.89 dollars. Preliminary estimates of volume were 87,770 contracts, down 25% from the final figure of 117,490 set earlier this week.
Bids for soybeans remained virtually unchanged on Wednesday, but rose 2 cents in an Illinois river terminal and 3 cents less at an Iowa processor today.
Poor road conditions resulted in the closure of Brazil’s main agricultural transportation route, BR-163, until Friday, which allowed repairs to be made. The country is transporting millions of bushels of corn and soybeans on the BR-163, where it is finally loaded onto ships in its northern ports. It only resulted in minor shipping delays as the market was already shifting back to US soy.
Despite all the tensions on the soybeans market, some smaller actors like Egypt took advantage of the situation, placing several 42,000 metric tons orders of Soyoil in an international tender March 6, for arrival in late April.
Recommendation for the future

China and USA are close to sign a trade deal this month however that does not mean the trade war ends. Trump warned that he can still walk out on China like he did with North Korea.
However, based on the forward curve and other information presented, we suggest to go long on the futures as we deem the chinese demand on the verge of increasing. Plus, we are confident that large trading companies will not make the same mistakes as they once did in the last quarter of 2018, if the trade war starts over.
Sources
‘ADM Fourth-Quarter Profit Misses as U.S.-China Trade War Stings,…’ Reuters, 5 February 2019. https://www.reuters.com/article/us-archer-daniels-results-idUSKCN1PU19R.
‘China Will Buy More U.S. Soy in “Good News” for Trade Talks’, 22 February 2019. https://www.bloomberg.com/news/articles/2019-02-22/china-will-buy-more-u-s-soybeans-in-good-news-for-trade-talks.
GmbH, finanzen net. ‘25 Million Tonnes of US Soybeans Will Go Unsold This Year as a Direct Consequence of the Trade War with China | Markets Insider’. markets.businessinsider.com. Accessed 7 March 2019. https://www.businessinsider.com/trump-china-trade-war-25-million-tonnes-of-us-soybeans-to-go-unsold-2019-2.
———. ‘Soybeans PRICE Today | Soybeans Spot Price Chart | Live Price of Soybeans per Ounce | Markets Insider’. markets.businessinsider.com. Accessed 7 March 2019. https://markets.businessinsider.com/commodities/soybeans-price.
‘Soybean Outlook – Soybean Market Defies Logic’. Farm Progress, 15 August 2016. https://www.farmprogress.com/story-weekly-soybean-review-0-30767.
‘U.S.-China Trade War Rattles Agribusinesses, Especially Bunge’. Reuters, 20 February 2019. https://www.reuters.com/article/us-usa-trade-china-agribusiness-idUSKCN1Q92UQ.
How the market has bean doing ? (soybean #3)
Price


Concerning the prices from those last 2 week, we can observe with the picture that represent the prices of soybean on a 1 year basis, that today the price is quite stable. It varies from USD 880 per hundred bushels to the price today which is USD 890 per hundred bushels.
It is quite a normal situation as the inventories from both biggest exporters, Brazil and USA are countering each other in the supply side. Brazil is exporting the old crop and USA the new one. It means that the supply side expect prices that are stable.
The demand is stable as Soybeans are needed over long term not for one period in time. Therefore the price is acting quite normally.
Forward curve

Two weeks later we still see the same trend regarding the upward trend, we already explain why the forward curve stay flat during the period between July and september and it is due to the seasonal pattern that we explained two weeks ago. Thus, it is without surprise that we can see the same phenomena happening at the same time of the year but one year later. The simple explanation for this is, again, the seasonal pattern that will occur every year at the same time. So basically, this forward curve is quite normal and we can see that the market is stable and well supplied.
News
Argentina replaces China as biggest U.S. soybean buyer
During the last three months Argentina become the top buyer of U.S. soybean. Almost 1.3 million metric tons of oilseed have been exported to Argentina from September 1 until 22 November.
As we already know Argentina tend to processes its own soybean in order to keep the add-value on the product. But giving the fact that China is looking for non-American soybean or soybean product, Argentina is willing to export more raw soybean and buying more from the U.S. in order to respond from the demand of China and also because Argentina suffer from a drought earlier this year.
U.S. soybean farmers struggle to find buyers amid Trump’s trade row with China
As mentioned in the previous bulletin, American farmers have been stocking a staggering amount of soybeans since their main buyer, China, has been denying their trade offer. In this situation, farmers still have to pay their bills, as one of them put it, “you can’t pay your bills with patriotism”. To remedy with that, the Trump administration has issued a $12 billion program to compensate the loss due to that trade war. Nevertheless, this still hasn’t been able to fully cover the costs of production. As of now, that costs is higher than the current cash price so the do not even have to possibility to break even.
https://www.agweb.com/article/argentinareplaces-china-as-biggest-us-soybean-buyer/
http://marketqview.com/forwardcurvechart.php?ID=74&TYPE=Price
https://www.japantimes.co.jp/news/2018/11/28/business/u-s-farmers-silo-instead-ship-record-soybean-crop-trumps-china-trade-row-rages/
https://m.nasdaq.com/markets/soybean.aspx
Soybean Bulletin N°2

Thanks to this graphic that resume the fluctuation of the price of Soybean for last month, we can observe that since the last bulletin, the price has sharply increased from 30th October to the 1st of November from 847.00 USD per hundred bushels to 887.75 USD per hundred Bushel. (Red circle) It can be explained by a simple reason.
It would be that soybeans start to be planted in Brazil. It means that the resources are scarce in the inventories. Indeed, if we take the seasonality of soybean, we can observe that the harvest for Brazil is done in March. Hence, they are actually selling today their old crop, which should be priced higher than their new crop because the supply is lower.
(High price for scarce resources/ Low price for abundant resources)
From the 1st November to today, the price has actually stabilized. The reason would be that we are actually starting the harvest in the USA. The new crop should be sold at a lower price, which is why the price has actually stabilized since then. The market of soybean is mainly driven by the supply of those two countries and by the huge demand of China.
Finally, the blue circle represents the increased in volume sold from one day to another.

As we can see, the forward curve does not change much within two weeks so we can assume that we need more time to see an evolution in the curve. We can see a carry from November to August and then it slows down from August to September and then we can see another carry until July 2020. The forward curve of soybeans tends to follow a seasonal pattern where we have the notion of old crop and new crop. The new crop period for soybean is in November so that is why we see an upward trend in the forward curve at this time of the year.
Moreover, we have a lot of supply so the price should drop but due to the fact that Brazil is becoming short on soybeans the U.S has a lot of demand coming from China so this could be the reason why the forward price keep following this upward trend.
US farmers refuse to sell their soybeans
Instead of selling their soybean crops right away, American farmers have decided to store their entire production in silos and containers. The reasoning behind this is the hope that the price of the commodity will rise in the coming weeks when government leaders hopefully have reached an agreement and lifted the tariffs barriers. For some farmers, It is not a choice since their only alternative would be to let their crops to rot. By the end of the crop year, the country’s total inventory of soybean would amount to 955 million bushels.
http://marketqview.com/forwardcurvechart.php?ID=74&TYPE=Pricehttps://www.farmfutures.com/soybean/us-farmers-storing-
soybeanshttps://www.thebalance.com/soybean-planting-and-harvest-seasons-809258
https://www.bloomberg.com/opinion/articles/2018-11-13/xi-jinping-not-trump-is-the-true-cold-warrior
To bean or not to bean – Weekly bulletin N°1
Price

As we can see the price of soybean for the last six months has dropped dramatically between the end of may until July, the reason for that is definitely the impact of the trade war on the price, it first appears in July 2018 when China imposed a 25 percent on imports of soybean coming from the U.S. as a response from the tariffs imposed by the U.S on Chinese export.
American soybeans are really important to feed the growing middle class in China, where soy-fed pork has become an important part of the diet. The demand will be even more important this fall when soybeans from Brazil will be rare because of the end of their season. The typical period during which the U.S used to ship almost half of his production to China is in October and November so that could explain the rise of the price even though the trade war is still there, China still needs soybeans coming from the U.S.
Heavy rains devastate harvests
For the second year in a row, heavy rains had a negative impact in the soybean production. On one hand, the farmers have trouble meeting their quotas of soybean production. On the other hand, the rain forced shipments to pass down the Mississippi River instead of the usual west coast. This creates a bottleneck for the transport, which leads to delays, which then leads to an increase in the price of the soybean.

Iran might become the new first importer of USA
Even though Iran had big political issues with the USA, some reports on Financial Times and on other websites showed that the USA were filling the gap that China left, once they started to increase the taxes of importation from them, with Iran. Indeed, Iran became the first main importers of Soybean from the US in August 2018. The data from the U.S. Census Bureau explained that Soybean exports from the USA increased in August, to 123.7 MB in 2018 compared to last year. It also informed that Iran purchased 15.2 MB of U.S. soybeans which was much more than the past five years.
Recommendation
Recently we observed that the price of soybean is quite low. So with basic business knowledge, it will be clever to buy at the lowest price and based on this price forward curve we can see that there is an upward trend, hence the price is going to be higher. Therefore, buy at a low price and sell at the highest price. Moreover, we have to be informed of the upcoming events during the trade war.

Sources
Daniel Shane, C. (2018). China may soon regret slapping tariffs on US soybeans. [online] CNN. Available at: https://edition.cnn.com/2018/10/01/economy/china-soybeans-trade-war/index.html [Accessed 28 Oct. 2018].
Macrotrends.net. (2018). Soybean Prices – 45 Year Historical Chart. [online] Available at: https://www.macrotrends.net/2531/soybean-prices-historical-chart-data [Accessed 28 Oct. 2018].
1, B. (2018). Soybean Outlook – Stop guessing, start selling. [online] Farm Futures. Available at: https://www.farmfutures.com/story-weekly-soybean-review-0-30767 [Accessed 28 Oct. 2018].
Press, T. (2018). Rainy harvest devastates Louisiana soybeans for 2nd year. [online] The Seattle Times. Available at: https://www.seattletimes.com/business/rainy-harvest-devastates-louisiana-soybeans-for-2nd-year/?utm_source=RSS&utm_medium=Referral&utm_campaign=RSS_all [Accessed 28 Oct. 2018].
Shedlock, M. (2018). Iran Replaces China as Top Importer of US Soybeans. [online] FXStreet. Available at: https://www.fxstreet.com/analysis/iran-replaces-china-as-top-importer-of-us-soybeans-201810302207 [Accessed 28 Oct. 2018].
Continue reading “To bean or not to bean – Weekly bulletin N°1”
Soybean – The panic has calmed down
Price
Brazilian soybean have been quoted in China at a $94 premium a tonne over July Chicago futures. In comparison, it reached in April a $160 premium, after the threat to set a tariff on US cargoes. Usually, the premium reaches about $50-60 a tonne at this period of the year.
The price for Brazilian soybean is expected to drop as the government has announced all-time record harvest of more than 119 million tonnes. Moreover, the current high price for Brazilian soybean has slowed down the Chinese demand. However, some traders declared that Chinese importers have booked 20 cargoes for a delivery in August last week.
Céleres, which is active in consultancy in Brazil, estimates that overseas sales of soybean will increase by 2 million tonnes in 2018, to reach an annual total exports of 72 million tonnes.
Price in USD/bushel

http://www.macrotrends.net/2531/soybean-prices-historical-chart-data
Pork’s demand is declining in China
According to Reuters, China will reduce its soybean imports for the first time in 15 years in 2018/19. The agriculture ministry has indeed noticed a dropping demand for hog which lead to a decreasing demand for animal feed. Hog prices in China registered one of the sharpest ever declines in the first quarter and are below average production cost. China’s April soybean imports fell to 6.9 million tonnes, a decline of 13.7% from a year ago.
“Most soybean plants in China are now overstocked with meal and oil,” said a trader in Beijing.
Forward curve – price per contrat (100 short tons (~91 metric tons))

http://marketqview.com/forwardcurvechart.php?ID=74&TYPE=Price

http://marketqview.com/forwardcurvechart.php?ID=74&TYPE=Price
The forward curve has changed compared to our last bulletin. The inversed shape from August to November has turned into a carry. It can be explained by the all-time record harvest of soybean in Brazil announced by the South American country government. It obviously increases the supply so the market has to carry the storage costs of soybean producers.
Crush spread (in cents per bushel)

https://seekingalpha.com/article/4170072-soybean-crush-spread-telling-us-demand-strong
The crush spread shows us how much money we can earn by crushing soybeans into soybean meal and soybean oil. The crush spread has these days reached its higher point since 2013. This represents a bullish factor for the price of oilseed. This changes affect also companies like Bunge, its stock has raised from $63.87 per share in November 2017 to over the $70 level. The same move has happened to ADM stock, from lows of $38.59 in November 2017 to around the $44 level.
Moreover, Bunge’s CEO and ADM’s CFO said that the severe drought in Argentina causes this increasing crushing margin and that their companies were profiting from it since they own many crushing plants.
News
- ADM recently bought a grain elevator in Manilla in Iowa. This purchase increase the storage capacity of the company by 2.3 million bushels, whose represents 1.5 m of bunker storage and 775.000 of upright storage. The infrastructure can also receive 32.000 bushels of soybean per hour.
- Some delays are occurring in China on discharging vessels and soybean are stored on a longer term basis until tests for GM material are concluded. China government keeps reporting finding seed-treated soybeans in shipments, but have not stopped trade due to this presence thus far. It could affect soybean imports if the government decided to react and set up some severe regulations on GM products.
- The Taiwanese Food and Drug Administration is currently drafting implementation regulations on a law set in 2014 on GMO food labelling. It impacts all soy products except soybean oil. This decision could slow down the demand for bulk soybeans coming from United States.
- In Japan, the U.S. soybean industry has seen trade perturbations due to detections of chemical residues that exceed the country’s tolerances. As U.S. soybean farmers use new herbicide mixes to eliminate weeds, there is a need to monitor those chemicals and the maximum residue level policies in export markets.
Blockchain
HSBC has made their first trade finance transaction integrating blockchain technology. This trade was conducted for a cargo of soybeans shipped from Argentina to Malaysia, involving Cargill Geneva, ING, and HSBC themselves, using a Corda blockchain developed by the R3 consortium.
HSBC’s global head of innovation, Vivek Ramachandran, said that “the need for paper reconciliation is removed because all parties are linked on the platform and updates are instantaneous.” He added that it is an inflection point for how trade is conducted.
The trade, instead of usually taking five to ten days for the exchange of all the documents, has here been made in only 24 hours. Moreover, HSBC said that they consider that blockchain could help reducing costs by 31%.
Video – HSBC’s blockchain engagement
https://twitter.com/HSBC/status/995778209416392704?s=20
Sources
http://marketqview.com/forwardcurvechart.php?ID=74&TYPE=Price
http://agriculturewire.com/soy-checkoff-keeps-tabs-on-transportation-issues/
http://www.businessinsider.fr/us/hsbc-ing-blockchain-trade-finance-cargill-soybeans-2018-5
http://www.macrotrends.net/2531/soybean-prices-historical-chart-data
https://seekingalpha.com/article/4170072-soybean-crush-spread-telling-us-demand-strong