Grains(Insights from the SRIC Trading Forum 2019)
Themes as drivers over the next 9 months
Trade war resolution:does a “deal” bring new demand to the US and the World or does it simply readjust global flows?
Current flooding in the US corn and soybean belt:do we have a major “prevent plant” for corn and does this mean a significant shift to soybean?
African Swine Flu:is the real impact being underestimated, with some reports suggesting up to a 20-30% reduction in the output of some South East Asian countries and China? Up to 200 million pigs could be culled or die from being infected as African swine fever spreads through China, Rabobank said. Knowing that China is home to the world’s largest pig herd which counted around 360 million heads in late 2018, the impact on the output would be huge and could not be supported by Europe and USA (2nd and 3rd largest producing country) production as the sole reduction occurring in China’s output is equivalent to Europe’s yearly pork output.
Market drivers over the next 9 – 22 months
Weather: Directly affecting short term yields, are we getting closer to a major, multi country weather event again? And how do we deal with what seems to be a reality that technology is flattening or compensating the impact of weather?
Technology: How exponential is the technology curve in farming and in the supply chain? Is an integrated supply chain a medium or a long term reality?
Traders: How much does an asset oriented supply chain impact trade flows? How much consolidation is coming and who will be the consolidators?
- In Russia and Ukraine, both the biggest exporters and producers of grains are national companies without any international network, so in a world leading to consolidation, how is this possible and what can be done by traders?
Consumption: How does ASF impact on the medium term and does it incentivize a switch to poultry ? Are we anywhere close to “peak consumption”?
- Poultry need half of the feed stuff to produce the proteins that a pig requires. But it still it’s more the consumer’s habits that drive the demand and the market for what people want to eat.
Trade news
An important turning point for Brazilian soy is starting to emerge as major grain traders are trying to negotiate the tariffs of the old Panama Canal for Brazilians grains ships delivering in China. According to traders, it is today cheaper by USD 206’000 for a Brazilian ship to go through the Cape of Good Hope, rather than using the congested new Panama Canal. Should the private port operators and the traders find common ground, it would be a win-win situation as the Panama canal would receive more Brazilian ships and the traders would save up to 5 days voyage.
Another news is regarding Louis Dreyfus, major grain trader, and its investments in an Asian poultry and food industry following an IPO – sources claim ten different investors limited at 5% maximum share. It is understood that this horizontal integration is done according to the diversification strategy of LD as the grains sector is facing an important diminution in both purchase and sales margins
Finishing with Brazil, we see another logistic disaster as a bridge, connecting large farming areas of Pará state to northern ports collapsed. Traders seemed not as distressed as barges still manage to sail up and down the river and alternative routes are available for any truck transportation. The region is approximately delivering 5% (~6 million tons a year) of the Brazilian soy annual production.
GMO Soybeans
In the US, 87% of the vast majority of soybeans are GMOs, according to GMO Compass whereas in Brazil, according to ISAAA, the area planted with GM crops totalled 50.2 million hectares in 2017, approximately ⅔ of the US cultivated lands. Europe decided to launch the strategic European Independence Protein Plan to develop all protein crops which are under cultivated in Europe. EU has a huge dependency on South America’s soy, as it produce only ⅔ of the internal demand.
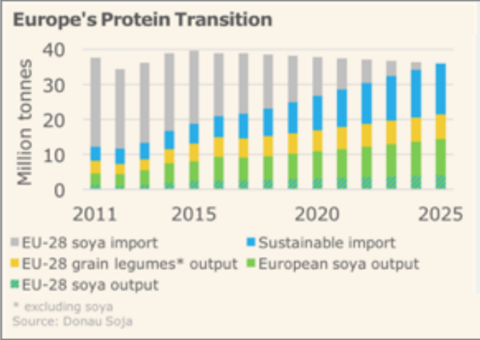
People are moreover looking for non-GMOs product and that’s what the EU tends to do with reducing the import of GMOs products. US and Brazil represents the biggest exporters of soybeans and the content of GMOs in their crops could likely close the doors of the EU market in the near future.
Price movement
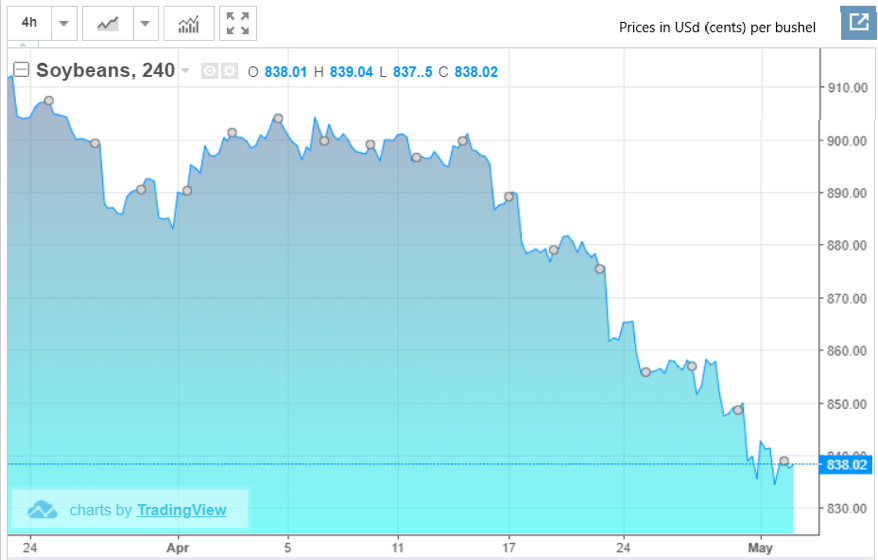
According to China Customs data, domestic demand for soybeans remained low compared to previous years and the March import of soybeans was at 4.91 million mt, 13% lower than the same period in 2018. The soybeans global outlook did not feel confident about the US-China trade talks.
Furthermore, government-related trading companies in China have delayed their purchases of US soybeans. “We have seen that China has bought millions of tons of American soybeans in recent months, but recently it has reduced its purchase because we have not seen many soybean movements out of the United States.” declared a trader.
According to the United States Department of Agriculture, the United States exported $13,366 million worth of soybeans from October 2017 to February 2018, and one year later, exports decreased by 37% to $8,411 million of soy.
The slowdown in soybean consumption, mainly in China, has created a lot of uncertainty as market players struggle to digest the excess supply of soybeans from the United States, Brazil and Argentina.
The spread of African swine fever in Chinese pigs has reduced the demand for soybean meal, a high protein animal feed, from the world’s largest soybean importer.
Last year, the US government set up a $12 billion agricultural aid package to mitigate the effects of declining farmer incomes. However, the Trump administration does not seem to help the farmers anymore. The U.S. Secretary of Agriculture Sonny Lies on Tuesday: “they can consider the option if the trade negotiations and weak commodity prices linger”. We can assume that it will depend on the polls of the upcoming elections, taking into account that those farmers are a major source of votes for US President Donald Trump.
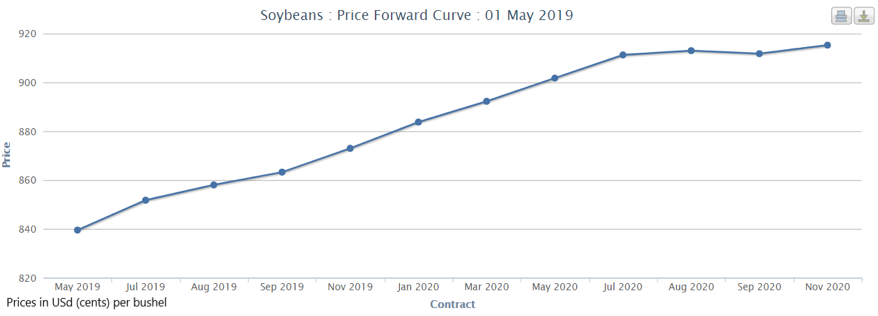
Recommendation for the future
The managing director of the International Monetary Fund, Christine Lagarde, said Monday that she hoped the US and China would reach an agreement to end their trade dispute, which baffled the financial markets and cast a shadow over the Mondial economy.
According to a poll by Reuters, Brazil’s soybean crop in 2018/19 is expected to be the second largest ever.
We are less optimistic than we once were and therefore would advise to take short position.
Sources
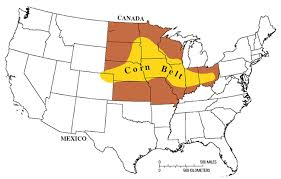
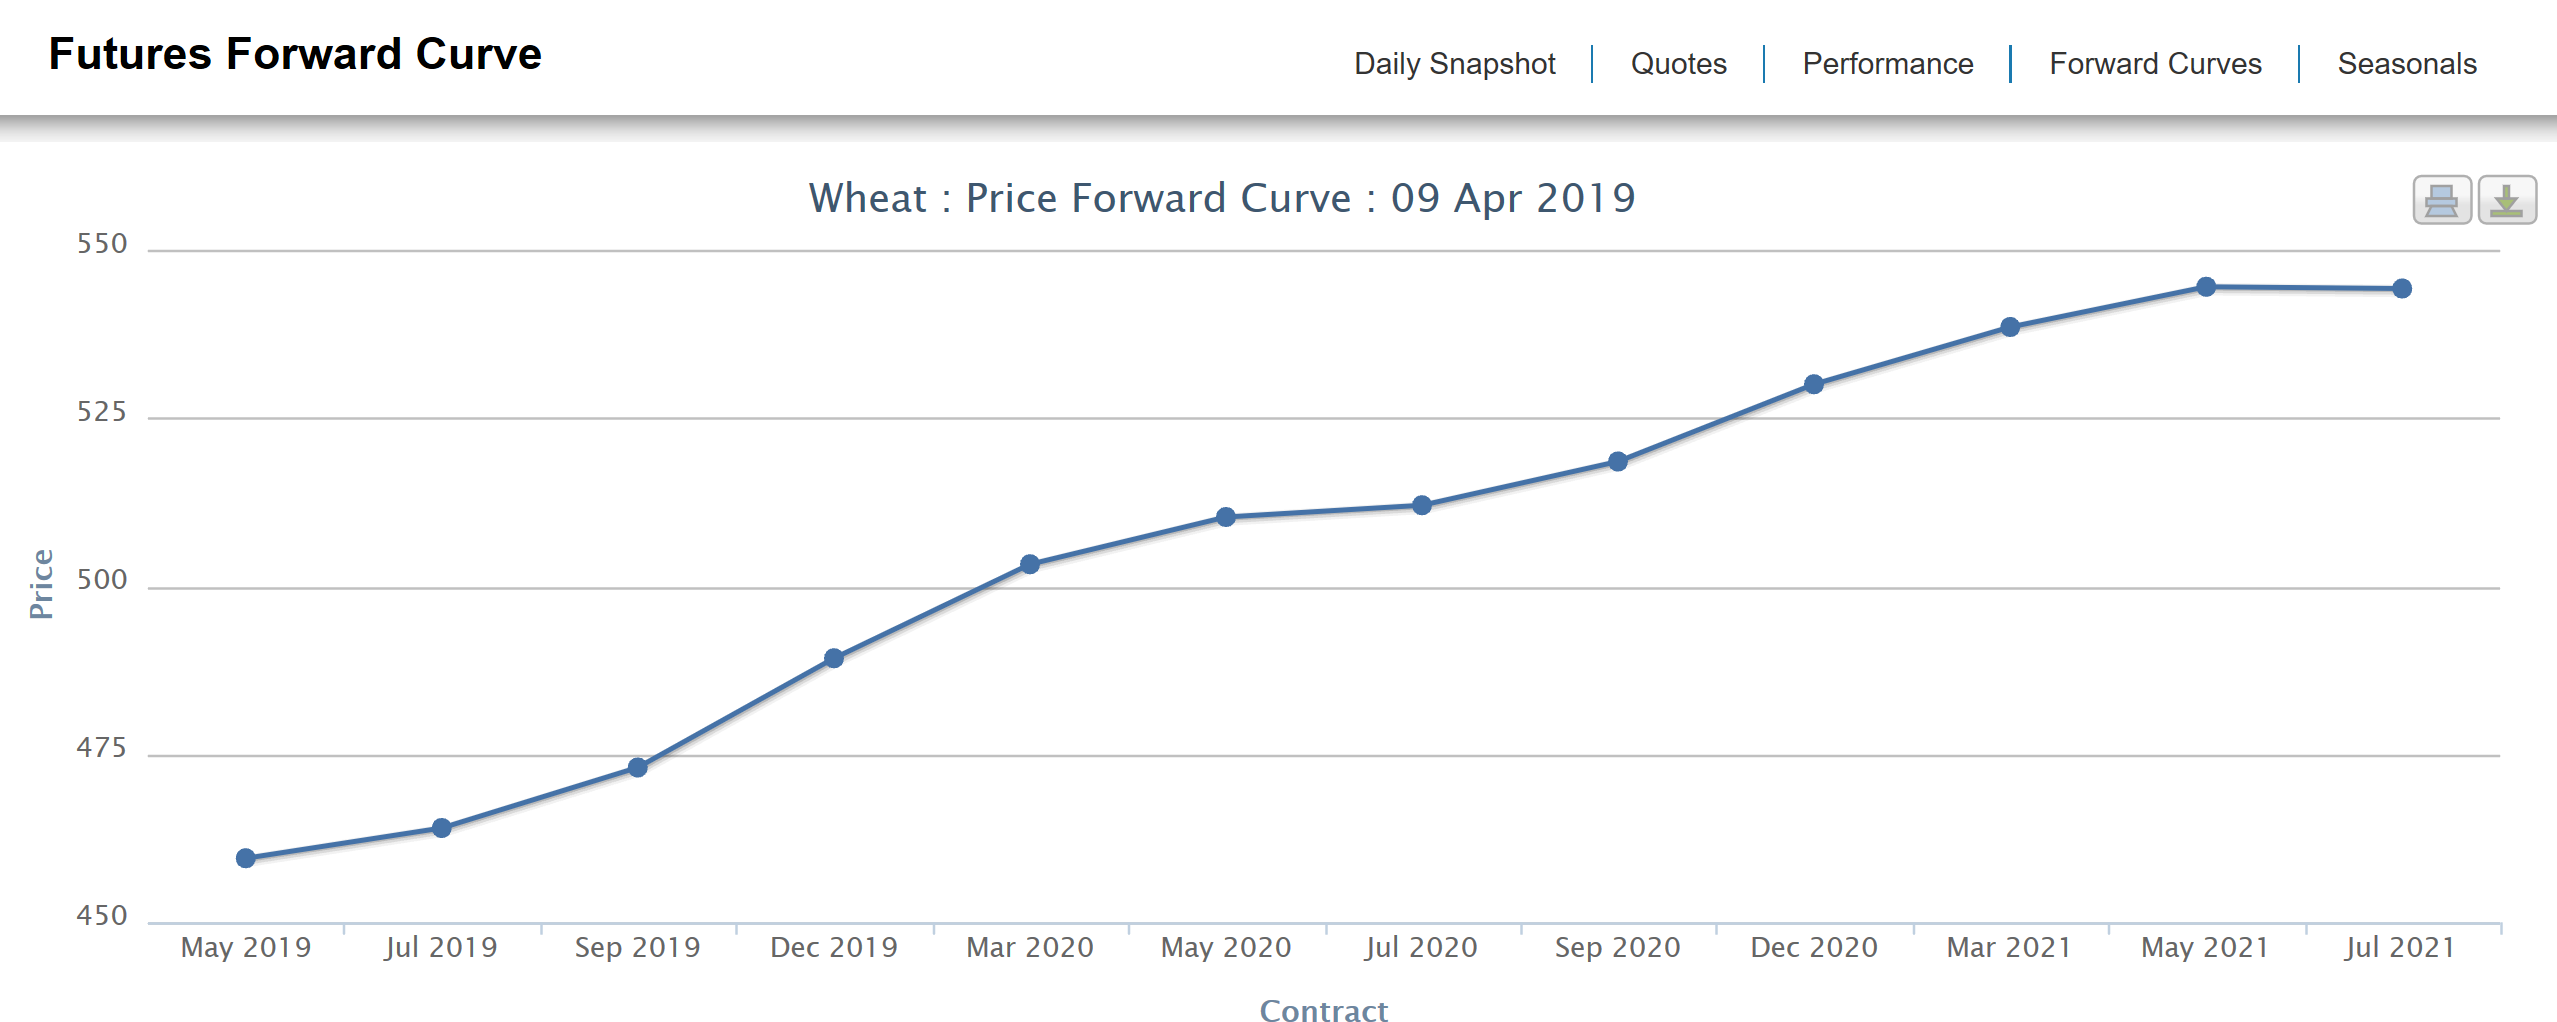
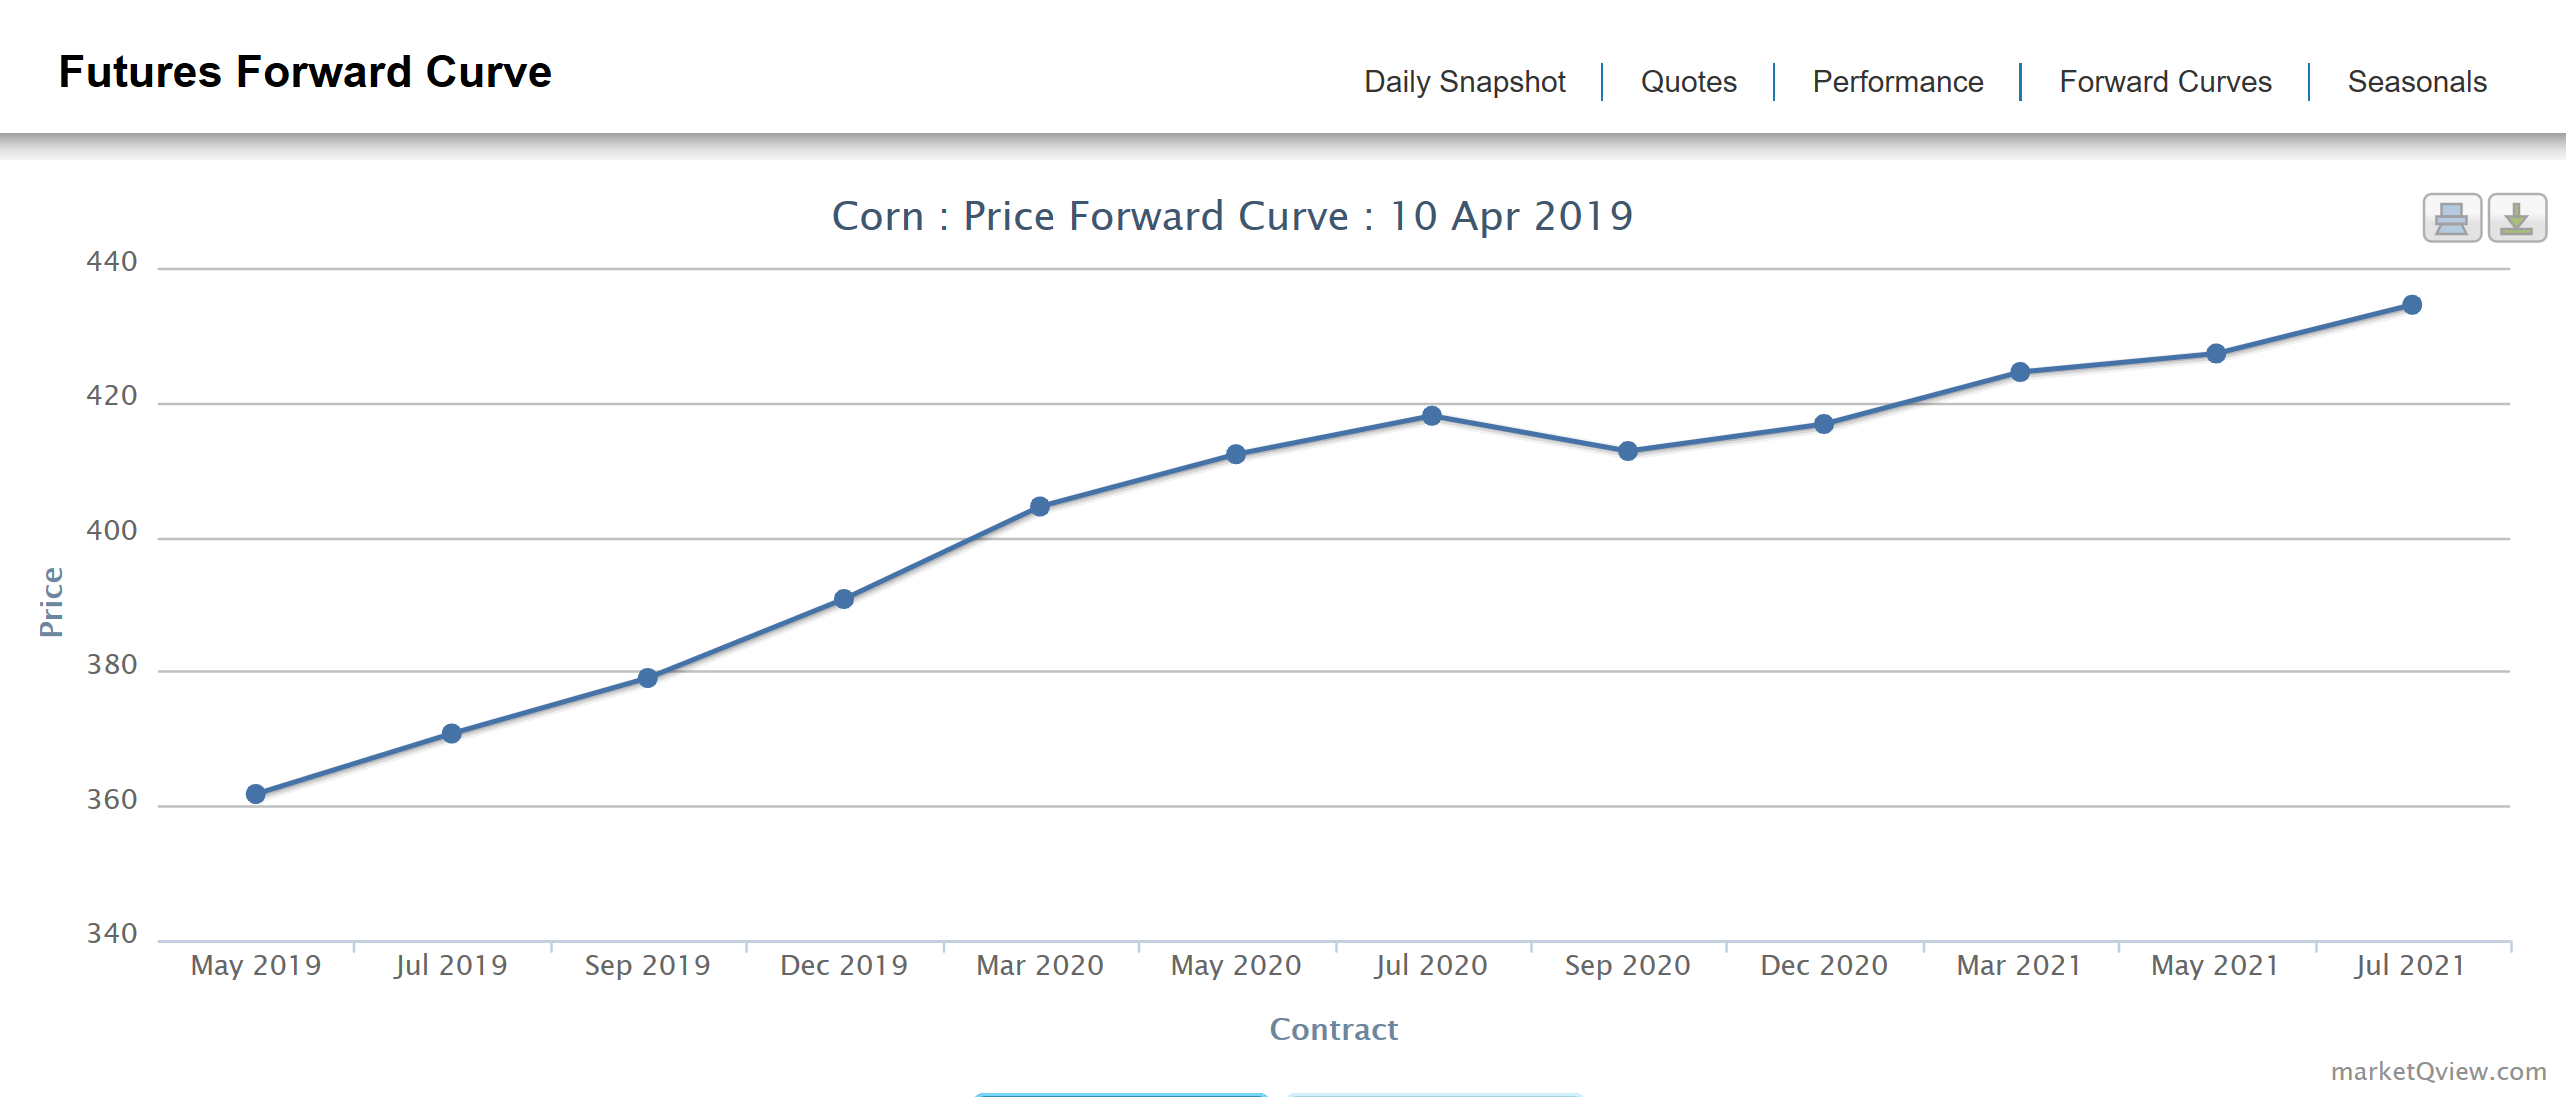 Figure 4: $/bushel