World’s major miners believe that copper market will be considerably better supplied in the mid-term than a year ago.
This positive view is due to a strong demand trend and the fact that copper companies think that new mines are needed. Those able to develop these new projects will increase volumes, profit and revenues. Therefore, the high copper prices in 2017-2018 have also encouraged few companies to invest in new copper projects. This new production will lead to an expected 900’000 tons a year more copper supply around 2020 than today.
It is forecasted that the copper deficit will shrunk from 600’000 tons to 200’000 tons. A slowdown in the demand growth is expected in the coming years from 2,5% to 1,9% of growth per year.
We also have to keep in mind that the global outlook is strongly influenced by China even though is rate of growth is declining. Furthermore, its economy is changing to an industry growing economy which demand a lot of copper supply to a consumption-based economy which has a lower demand.
Copper producers must nevertheless keep an eye on the market and introduce flexibility into their new project to ensure maximum profitability. Indeed, the slowdown in demand from the developed countries and the speed at which China demand slows remain uncertain and could affect producers’ new projects.
MMG Ltd plans after tax hike in Congo
After Glencore and ERG another foreign miner is reviewing its future production plans after the government increased taxes and removed investors safeguards.
MMG Ltd which is a Chinese state-owned enterprise is considering to invest in more expensive methods of mining the metal when existing oxide resources are exhausted.
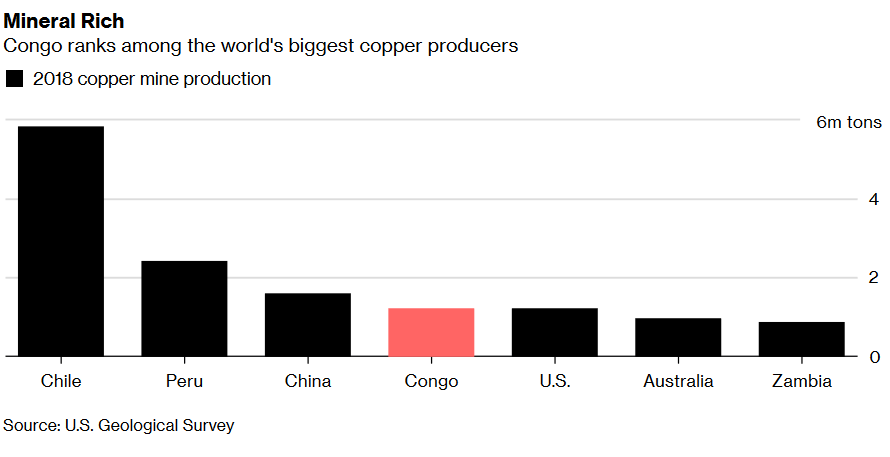
Congo ranks alongside the United States as the world’s fourth biggest cooper producer and the largest source of cobalt. A supply change in Congo could have the potential to impact the cooper and cobalt prices, which have declined in the past due to that trade war between the U.S and China.
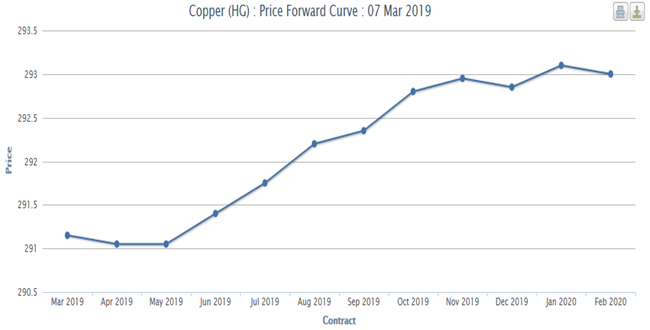
Forward curves
Current
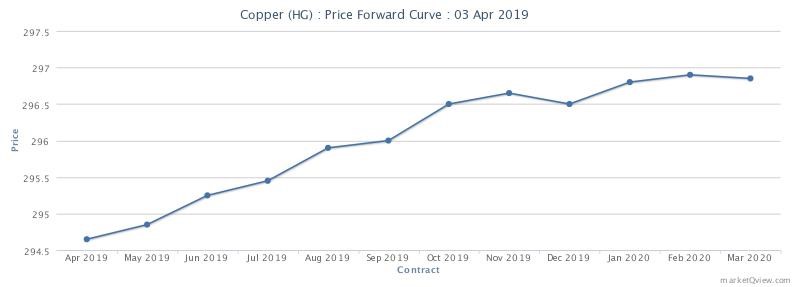
Current
By comparing 2 forward curves below, we can notice some changes in the copper market. In the previous curve, the market was in the backwardation from march to April, meaning that the there was an undersupply situation. In the current curve, we are in contango. The market turns from a bullish to bearish market to an oversupply situation.
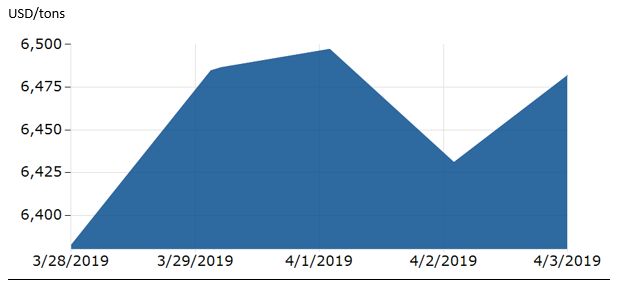
Spot Price
We can see a drop in the copper price during the month of February probably due to the Chinese New Year. Prices start to rise again on March as Chinese demand restart as well as the economic growth. The copper market is still undersupply which add even more pressure on prices.
Copper futures forward curve. MarketQview(online). 28thMarch 2019. (Consulted on 31th March 2019). Available at the URL:http://marketqview.com/forwardcurvechart.php?ID=18&TYPE=Price https://www.ft.com/content/2d2eef1e-5187-11e9-9c76-bf4a0ce37d49 Global copper market under supplied, demand on the rise — report (online). (Consulted on the 2nd April 2019) URL:http://www.mining.com/global-copper-market-supplied-demand-rise-report/ Futures Forward Curve (online). (Consulted on the 2nd April 2019) URL: http://marketqview.com/forwardcurvechart.php?ID=18&TYPE=Price https://markets.businessinsider.com/commodities/copper-price MMG Joins Glencore, ERG Reviewing Congo Plans After Tax Hike (Consulted on the 2nd April 2019) https://www.bloomberg.com/news/articles/2019-04-03/mmg-joins-glencore-erg-in-reviewing-congo-plans-after-tax-hike
As shown in the graph above, the price of 22nd March stands on 1280 USD. Comparing to last bulletin price (of the last day), the price dropped from 1’482 USD to 1’280 USD which represents approximately 13.6% decrease in the price which is significant.
This price decrease might be due to the price stabilizing after the increase that it held during the chinese new years (explained in the previous bulletin).
As a trading company, this significant decrease in the price of freight can represent an opportunity to increase the profit margin of the company (as there is a decrease in costs for a deal). It is possible that trading companies schedule the transport with the freight according to their expectations of the price movement but the price cannot be predicted with 100% certainty which means that it is not an easy task.
Freight risk – The effect of the freight price on the trading company depends on the incoterm which the contract is referring to. In case the transportation costs are under the responsibility of the trader company , then the price volatility does affect the margin of the trader.
In contract, freight risk does not have this level of effect on trading companies like Cargil for example that use vertical integration (meaning that they would take the shipment operations under their responsibility as well as the actual trade). This means that not only the margin will increase due to the decrease in the number of involved parties but also means a decrease in price will drive costs down for the trading company.
Energy trader Mercuria gets green light to buy Aegean Marine Petroleum
In light of the new IMO 2020 regulations, shipping rates are expected to rise as vessels will need to buy fuel of better quality and thus more expensive.
Mercuria, the global energy trader, are going to buy Aegean Marine Petroleum. This company is a marine fuel Logistics Company that physically supplies and markets refined marine fuels to ships in port and at sea.
Mercuria sees the acquisition as key ahead of new rules on shipping fuel by the International Maritime Organisation (IMO) due to take effect next year.
We can see through this acquisition how freight rates and decisions regarding shipping could affect trading companies. They are now trying to have a larger control of the shipping sector as well.
Freight derivatives – Risk management tool Derivatives are used to hedge risk in the freight markets. Tankers are one of the most common means of transporting commodities such as oil and coal. Freight derivatives, such as swaps or forward freight agreements (FFA), can be used to protect ship owners against changes in freight rates. Commonly traded on the Baltic Exchange, dry (bulk) and wet (crude) freight derivatives are traded for particular routes and forward months in standardised sizes of vessel.
Cargill Net Drops 20 Percent, Revenues Fall as Trade Fight Bites
Cargill, the world’s biggest agricultural commodities supplier, reported 20% of drop in its fiscal second-quarter 2019 net earnings. The reason of company’s bottom line decrease is indeed due to the global trade tensions together with the challenges in the Chinese hog sector and a struggling U.S. dairy business . This drops shows again how volatile the commodity markets is and how the the external factors can impact company’s net profit significantly.
Then, in regards to the Freight commodity, Cargill has additionally to this 3 business units, an “ocean transportation”units, more precisely “dry shipping services”, which is highly impacted by the U.S.-China trade fight as it brings uncertainty in the freight markets.
These 3 indexes behave quite similar, meaning that the reasons for the volatility of the price of freight for the 3 of them would probably be similar, however, effect each index in a different level. For example : it is possible that the chinese new year had a greater effect on BDI than BHSI, as the change in the price was more significant. at the same time, it is possible to see that the timing of the trends is quite cohesive which makes their behaviour similar. https://www.pacificbasin.com/en/ir/industry.php
Two weeks ago, we have seen the composition of the gasoline price in the US, now as requested, here is a video which explains the composition of the price of gasoline in Switzerland
Unfortunately, the video is in german with french subtitles, it was impossible to find it in english.
In order to illustrate the seasonal pattern of the gasoline that we explained last week we can see the price in Switzerland per months.
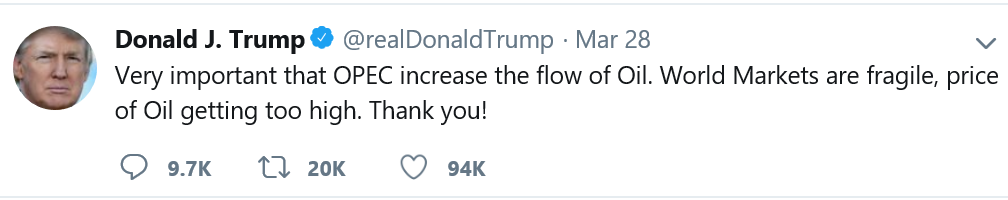
The past few weeks have been very interesting in the oil market. Oil prices took a bit of a hit and President Donald J. Trump has Tweeted on the 28 of March 2019 that OPEC should increase the flow of Oil in order to decrease Oil price. OPEC did not react to Trump’s Twitt. Experts in the oil market have showed that Trump’s Twitt war with OPEC and Russia is waning. Indeed, even if the market react violently to Trump tweet on OPEC, it very quickly recover to its old price levels. Trump’s anti-OPEC rhetoric is clearly losing importance and impact.
Another important new in the Oil market is the Venezuelan crisis. Venezuela, which is a key Oil producer have shut down all operation due to issues the country is facing. During the past few weeks, China has sent humanitarian help to Venezuela when humanitarian aid from the US has been blocked along the Venezuela-Colombia border. Many people in the Oil industry believe that a trade war is taking place there. When the US and other western countries are struggling with high Oil price, in China the situation is totally different. All trading houses in China are state-run companies. During the past week, Chinese companies have received orders from the Chinese government to produce more Oil even if the cost of production and storage is relatively high. For instance, Sinopec, one of the largest refiner and one of the two largest oil and gas producers in China has announced a fourfold increase in capital spending. This is a direct response to Beijing’s call for oil and gas companies to boost domestic production.
With thin profit margins in the oil sector, commodity trading houses have been looking for the next big movement in the energy industry. Trading giants such as Gunvor Group LTD, Trafigura Group Pte. Ltd and Vitol SA are all investing into the liquefied natural gas sector. They are all looking to buy more natural gas and therefore move away from dirtier and high pollution commodity such as crude oil. The world’s biggest commodity trading houses are looking to reshape the energy industry but they are also looking a new way to increase margin. The 27 March an article from Bloomberg has quoted Mr. Russel Hardy, the Chief Executive Office of Vitol who said that “ The liquified natural gas sector looks like a much younger crude market,it is an area that can grow and that is positive for trading houses”
To conclude, there were many important news related to Oil market, but what we can retain is that many important trading houses such as the Chinese Sinopec, have reported a huge drop in profit. For instance, Sinopec has reported a 76% drop in its latest quarterly profit for October- December 2018. The OPEC supply cut, the Venezuelan production shut down and the Iranian sanctions have lead to the biggest inventory reduction when stocks normally increase at this time of the year.
When looking into the diesel situation specifically, there is a growing problem which is dubbed the illegal diesel trade. It is mainly present in the city of Dubai and the official has organised a dedicated task force in order to the tackle this growing problem. And that problem is that 62% of the companies inspected by that task force regularly trade illegal diesel. That illegality comes from the sulphur content in the diesel, which based on the Federal Cabinet Decision No. 37 of 2013 the sulphur content must be extremely low. Specifically, the content must not be over 10 parts per million (ppm) of sulphur. That 62% of companies were trading diesel barrels with sulphur content that far exceeded that limit. Not only is it a violation of the UAE, but also results in extremely harmful gas emissions.
From HR Maritime, the number of trading houses around the lake is high.
Let us remember that the leman region is
On the left: % of nbr of trades (from HR maritime) On the right: USDA report on coffee world production
There are many commodity trading house of coffee and cocoa in Geneva. We will focus on some of them.
The big players of coffee are nearby :
Sucafina
Louis Dreyfus
OLAM international
Ecom agro (in Lausanne)
Many small/medium size companies:
Walter Matters
DIT
Traders in coffee are usually traders in Cocoa as well. So if you find a coffee trading house, there is a very high chance that it trades Cocoa as well.
What you can usually find on the traders’ website news are usually the same:
M&A
Sustainability
CSR
Actions in favour of 3rd world countries
It seems like they put a lot of effort into marketing themselves as good companies or big companies that buy other companies.
Where do the traders hang out? According to some traders:
Chez Philippe
River Side Café
Very well situated according to the map
What about coffee/cocoa traders? Where can we find them?
SCTA (Swiss Coffee Trade Association)
Themes:
Where are they?
We find all the big buyers and traders in the list:
Also:
Where sponsors are mainly coffee buyers. We can find big players:
Mövenpick
Jakobs Douwe Egberts (joint venture of Mondelez and DE master blender)
HERMO (torefactor company in Switzerland)
Lavazza (Italian company big in the coffee market as buyers)
Coffee traders wage according to “glassdors”:
Also seen: 75-80k in other job offers in indeed.ch (for coffee/cocoa)
(All sectors)
In Switzerland
In Geneva
The jewel in chocolate – Cocoa business in Asia
According to an article from Reuters, many markets in Asia are showing a grow appetite for chocolate-based products. This might mean for cocoa trading companies that Asia could be one of the current market to target and to supply. Indeed, Olam International, a leading food and agri-business supplier and coffee/cocoa trader listed on the Singapore stock exchange, decided to boost its presence in this sector in Asia and planned to supply more cocoa thanks to an investment in the origination, processing and research of this commodity in Indonesia.
The company acquired 85% share in the parents of Indonesia’s largest cocoa processor (BT Cocoa) by making an investment of $90 million.
The project is the following; making an international surplus of 100’000 tonnes from the upcoming cocoa crop. We could imagine that traders would have to face to a decrease of the cocoa’s price due to this surplus.
In such a situation, it is highly recommended to be long physical and short future for cocoa.
Besides cocoa, Olam International’s CEO, Sunny Verghese, told that coffee’s market could potentially face to a rally.
As cited in the previous bulletin, Brazilian coffee producers expect to get a bumper harvest of Arabica and Robusta’s coffee beans for 2019, that would normally decrease the price of coffee. However, Sunny Verghese added that this bumper harvest might be lower than expected because of possible adverse weather conditions in Brazil.
This information might tell to coffee traders to be prepared of an increase of the coffee’s price.
The recommendation for coffee’s traders would be to be short physical and long future for coffee.
As a result, coffee and cocoa will probably show an interesting change in their prices that traders have to capture.
This newspaper is interesting for students in commodity trading’s major at the HEG or in commodity trading master at the University of Geneva, who are interested by coffee and cocoa trading and by emerging markets such as the Asian market. Indeed, companies based in Geneva such as Olam International will need dynamic and young graduated traders to meet the demand in these markets.
Sucafina prize of excellence for the master’s thesis in commodity trading
The CEO of Sucafina, a multinational coffee merchant founded in 1977 and based in Geneva, has awarded the Sucafina prize of Excellence to a student at the Geneva School of Economics and Management (GSEM) for his Master Thesis in commodity Trading.
This newspaper might be interesting for students in commodity trading who have to write their bachelor/master thesis about a topic in Commodity Trading.
Such an award demonstrates hard work and skills which might open doors for interesting opportunities in commodity trading companies.
Review of February market situation of Cocoa
The cocoa is a niche market having a total production of 4.65 mio kg per year which is quite small compared to coffee with a total production in 2017/2018 of approximately 9600 mio kg per year. This means a production more than 2000 times bigger than cocoa.
The organisation having the biggest influences over this market is ICCO, International Cocoa Organisation, which functions such as OPEC but for cocoa.
There are 2 futures market, one situated in London (ICE Futures Europe), and one in dollars in New York (ICE Futures U.S.).
Finally, for the spot price, ICCO provide also daily prices denominated in U.S. dollars.
The chart below shows the development of the futures prices on the London and New York markets at the London closing time. Both prices are expressed in US dollars in order to compare them easily. The London market is pricing at par African origins, whereas New York prices at par Southeast Asian origins. Indeed, Cocoa need to grow hot and humid region that is why, we will find mainly production in Africa mainly dispatch between Côte d’Ivoire and Ghana and in Asia, mainly in Indonesia.
We can observe on firsts days of the chart, a quite strong difference of futures prices between the two markets. It can be explained by the implementation in May 2017 of changes in the grading rules for ICE Europe. That led to a substantial increase of prices due to higher norms for cocoa which impacted the African market. For instance, 2’000 tonnes failed the submission for grading because of that rule. However, we can see a convergence from 5thFebruary which were due to return to normal market configuration.
By looking at the global trend in February, the market is in contango, the contract prices perked up on both the London and New York markets as seen.
This upward trend can be explained by weather conditions adequate for the growth of cocoa in some West African cocoa growing regions as well as good expectations from market participants and forecasters.
Subsequently, compared to prices at the start of the month, future prices rallied by 9% from US$2,083 to US$2,269 per tonne in London, and by 3% from US$2,178 to US$2,238 per tonne in New York by the end of February.
However, at a certain stage, the supply exceeds the demand. The price stopped to increase and therefore, this bullish stance did not continue. From 20thFebruary onwards, projections suggesting that the top cocoa supplier was racing toward another record level in cocoa production resulted in a downward turn in prices. Thereafter, the front-month contract prices plummeted by 2% from US$2,310 per tonne to US$2,269 per tonne in London, and by 3% from US$2,302 per tonne to US$2,238 per tonne in New York.
Sucafina, 2018. “Sucafina prize of excellence for the master’s thesis in commodity trading”. Sucafina(online). November 30th, 2018. (Consulted on March 26th, 2019). Available at https://www.sucafina.com/news/news-updates/sucafina-prize-of-excellence-masters-thesis-commodity-trading/
Trader are currently facing a lot of uncertainty and pressure due to the next week report USDA which will give precise information about the choice of the farmer regarding the types of crops that they have chosen to plant. This will have a direct impact on the supply side at the global scale. Therefore huge variation of cash price have happened recently.
usd/bushel
(Cash price for Wheat)
usd/bushel usd/bushel
As you can see
above, forwards curves for wheat and corn are quite special as they are
always/often in contango.
This fact is
due that it has to always cover the cost of carry to give the incentive to the
farmer to keep growing this agricultural product. May to July are the only
months when the contango becomes less steep for wheat.
This is due to
the harvest period and the market is full of new crop. However for the corn, it
is from July to September that the supply become huge and takes over the
demand.
By logic, as
the market is bearish it will reverse the forward curve for two/three months.
Finally, when the market become more bullish as the demand is higher, the
forward curve becomes again in contango. This feature is very typical for
agricultural goods.
USDA Planting Intention
Each year, at the end of March, the US Department
of Agriculture releases its Prospective Plantings report which is based on
surveys and states what the farmers are intending to plant for the coming year.
It is a powerful tool as it provides the market with an expectation of the size
of each crop for the year.
Corn and
Soybean seems to be a great dilemma right now.
According to
Fram Future analysis based on weather forecast and estimations, corn should be
more profitable than soybean but also riskier as processes are more complex.
A survey based
on estimations of the plantation is going to be publish end of March by the
USDA, showing accurate numbers about the acres used for corn.
As for now, the
supply is still uncertain waiting for the numbers to come. If acres used for
corn are less than 91.5 million and yield diminish slightly, stock in the US
would reach a 5-year low rate stock/mass-needed (under 10%). If such hypothesis
are confirm by the USDA plantation report, December futures price should
increase as supply is weakening. In summary, the whole year is actually getting
planed for the corn supply side in the US and solid assumptions about the
market are going to be made next week based on that report and famers
plantations.
Last month
2018/19 U.S. corn outlook is for lower corn use for ethanol, reduced exports,
and larger stocks. The corn used to produce ethanol decreased by 5 times (from
25 to 5.5 billion. This conclude with a decrease on the season average corn
price by 5 cents to get a price of $3.55 per bushel. Also, for the substitute
of the corn which is the sorghum, there is a decrease in the export of 15
million bushels, to get a total amount of 85 million which is the lowest since
2012/2013. The production of corn is unchanged as the increase
in yield forecasts is offset by a reduction in acreage. The corn production
increased for India but reduced for South Africa. The major change in which we can focus in 2018/2019
is higher projected corn exports for Argentina and Ukraine and reduction for
the United States. China’s corn feed and
residual use is raised with lower sorghum and barley imports. Corn imports are
raised for the EU and Canada. Foreign corn ending stocks for 2018/19 are
lowered from last month, mostly reflecting reductions for China, Brazil, and
Argentina.
Wheat:
Wheat
production, exports and consumption:
Global wheat
supplies are lower due to smaller crop forecasts in Iraq and Kazakhstan.
However, Global trade is expected to stay unchanged as lower wheat production
in certain countries is offset by a larger one in others. Exports are
increasing from the EU and Brazil but lowering from the US and Mexico.
The EU is
expected to increase its export to 23 million tons as it is experiencing an
improved export competitiveness thanks to a price discount to Russian wheat,
the improved competitiveness should continue for the rest of the trade year.
The EU is now having a more prominent role in supplying African and
Middle-Eastern countries. Egypt, the world’s biggest wheat importer recently
shifted from buying Russian wheat to buying EU wheat, mainly from France and
Romania.
The projected
world consumption is reduced by 5.1 million tons to reach 742.1 million and
India accounts for 3.0 million of the decrease. This reduction is based on an
upward revision of the wheat stocks estimates for 2019. Global ending stocks
are increased 3.0 million tons to reach 270.5 million tons, which is 3 percent
less than last year’s record.
As a trader point of view, the recent change in supply of Egypt from Russia to Europe is an opportunity to save money on the shipment as france and romania are much closer in term of distance than Russia.
usd/bushel
Historical
seasonalities have shown that the price of wheat reach a peak during
Jan-Feb-March. Therefore, when looking at the already existing average price
for 2019, we assume that the cash price is going to fall even more during the
year due to seasonality, probably closing the year lower than it started.
LNG trade reached 319 million tons in 2018, this demand growth are led by Asian countries such as China, India, South Korea and Pakistan, 37 million tonnes of new LNG capacity added in 2018, moreover 35 millions of tonnes additional supply expected in 2019, this is due to coal to gas switching. Biggest exporter are Qatar, Australia, USA and Russia.
Here is the price chart of natural gas in Henry Hub, which is the US benchmark. As natural gas is a seasonal commodity, the demand has an impact on prices: the demand of LNG grows during the winter because people need to heat their home. At this period, the quantity of LNG is low, because people are cold, they need a lot of LNG and the demand increases. That is why we can observe these peaks in December and January. More over since 5 year the price never reached this high in December, this is due to china doubling imports of LNG to counter air pollution, which represented 176 million tonnes of carbon reduction in China winter air quality.
The price of natural gas decreased in the middle of February and raised slowly in March because spring is coming.
Here is the graph of the UK National Balancing Point, which is the natural gas’ reference for Europe. This graph also shows the seasonality of this commodity.
For the Asian market, there is the JKM, the Japan Korea Marker as benchmark for spot physical cargoes of LNG. These cargoes are delivered into Japan, China, South Korea and Taiwan. These countries represent the majority of global LNG demand.
This graph also shows how the weather influences the price.
Firstly, the alternation between the winter and summer season leads to regular variations during each year.
Secondly, we can distinguish the European hub destination price from the 3 others (Southeast Asia, Latin America and Australia) due to Russia, Algeria and Norway supplies.
Moreover, the correlation between the crude oil price from Saudi Arabia in particular and the LNG price play a major role in the demand. Indeed, an increase of crude oil price encourage the substitution of natural gas, which would increase the LNG demand. Therefore, the LNG price will rise if the supply stays constant or decrease.
It is probable that the current Khashoggi affair would bring out the rise of crude oil supply from Saudi Arabia in order to stifle this big incident in the Istanbul consulate.
Under pressure, the Saudi kingdom had to admit Mr Khashoggi’s killing.
Therefore, a collapse of price of LNG in Europe in particular significant at this time, leading to losses in factories.
Finally, the cooperation between Russia and South Korea for an increase of LNG purchase from Russia, in order to diversify Korean gas imports channels, is developing. The benefit of localisation is leading to this initiative of “gas bridge”.
In order to better understand gasoline and diesel market, it seems important to understand the difference between both. Diesel and gasoline come from the same source which is crude oil but the refining methods vary.
Gasoline, also called petrol is a fuel used for private vehicle and small aircraft.Diesel also called gas oil is used as home heating fuel in some western European countries but also for agricultural machinery, cars, lorries, and others road transports. In principle, diesel fuel is easier to refine than gasoline.
The major difference between the two is found in their consistency and the type of engine using it. Diesel fuel is refined to a thicker and more oily consistency, while gasoline is refined to a lighter consistency. Gasoline is also more flammable than diesel and requires less heat for combustion. Diesel engine are generally more fuel efficient because diesel is thicker than gasoline. Diesel combustion emits less carbon dioxide and carbon monoxide than gasoline combustion, but it also emits more particulate matter. Diesel engine is more popular in Europe than in the US.
At first Diesel fuel was less costly to refine than gasoline, but since 2006 and 2010, the introduction of ultra-low sulfur diesel has increased diesel production costs as it requires more refining. In average gasoline is more expensive than diesel in most countries. Many countries tax diesel and gasoline differently. For instance, the US tax on gasoline is 18.4 cents per gallon and 24.4 cents per gallon for diesel. In contrast most European countries have lower taxes on diesel than on gasoline. Since taxes are one of the most important factors determining the final consumer prices of fuels.
The spread between diesel and gasoline prices also varies over time with the different factors such as:
Supply, demand and seasonality..
We took this graph to illustrate the correlation between Gasoline, Diesel and Crude oil, indeed, the price of the Crude oil will have a direct impact on the Gasoline and Diesel. Moreover, this shows perfectly the volatility of these commodities.
When we look closely to gasoline, we can see that the graphs illustrate a seasonal pattern, gasoline tend to rise starting in the spring and tend to decline on the late summer and fall. This reflects the beginning of summer-grade gasoline, which is more expensive to manufacture due to its more exigent production process, in February and March.
Now, regarding the actual price of the gasoline, we can see the increase of the price per gallon due to the seasonal pattern explain above. The decreasing curve in February is also due to large gasoline inventories (high refinery runs driven by increased distillate demand in general) combined with lower demand for gasoline.
Big Oil
The seven largest publicly traded oil & gas companies are known as “Big Oil”. These include BP, Chevron Corporation, ExxonMobil, Royal Dutch Shell, Total, Eni and Conoco Phillips.These corporation, for the most part, include two or more firms in their group, for the exception of Royal Dutch Shell operating with only Shell, as it can be seen in the graph below.
This term include the dominating corporations that have a high influence in the market and setting prices. However, it does not include national producers and OPEC oil companies which often have a greater effect and influence on the price.
The copper price exchanged on the London Metal Exchange suffered over the
week as the prospects of the world economy have darkened.
This turbulence zone is due to the downward revision of growth prospects in
the Euro area and the Chinese’s data on exports, which shows a decline. The
equation is complicated for Beijing, which is still in the midst of a trade war
with Washington.
In dollars, Chinese exports fell by 20.7% over one year in February,
while they had increased the previous month announced the customs
administration. The imports also continued to fall, dropping by 5.2% which was
stronger that January.
It is important to remain that the metal market is particularly
vulnerable to these figures, as China is the world’s largest importer of raw
materials.
Indian Copper Smelter
Vedanta Ltd. (Mumbay
based company) was hardly impacted when an indian court refused to authorised
the resumption of the company copper’s smelter with a capacity of 400’000
metric tons a year which reprensent 40% of the country capacity. Indian imports
of refined copper jumped, even though the country was already a net importer of
refined copper.
This decision also
impacted the copper price in London which started to increase. The demand rise
and put pressure on the supply side.
On the other side,
imports on concentrate copper slump as the country has no capacity to refine
it. That would mark the lowest imports in the last 13 years.
Price
Price:
USD$/Tonne
The chart below shows
the copper price evolution for 1 month (Feb – March). We can notice a huge
increase from mid-February to the 1st of March. The increase is
probably due to the low stocks and important Chinese demand. LME warehouses reached 139,500 tonnes, close to the 10-year low of
122,500 tonnes in December 2018.Nevertheless, from the beginning of march,
there is a small decrease due to some rising inventories and drop (-0.5%) in
copper premium grade-a (Shanghai). The stock in LME warehouses rose to 120 075
tonnes from 116 872 (lowest since 2008). In term of supply, the market seems to
be undersupplied. The existing mines are already operating at full capacity and
therefore cannot at the moment respond to tighter markets.
Forward curves
The forward curve below
shows the state of the market today. We can notice a small backwardation from
March to April 2019. It means that there is an undersupply situation (Demand
> Supply). The market is relatively a bullish (strong) market. However, from
April to May 2019, there is a kind of “incertainty”. Finaly from May 2019, the
situation is changing for a contango.
Recommandation for the future
Investors that want to profit from the move in copper prices should buy
long-dated copper futures contracts as we are heading to a contango situation
around May 2019.
From the beginning of the year, Colombian coffee farmers are suffering of a huge fall or Arabica coffee price at the New York market which affects the country.
Because of a decrease of the coffee price below $1 per pound, coffee growers in Colombia are not able to cover their production costs and to generate a profit.
The reason is that the New York market is highly focusing in Brazilian coffee production and not enough on Colombian and Central American production. We will talk about it in details further in the bulletin.
The result of a fall of the coffee price will decrease the production of Arabica coffee from Colombian farmers. Knowing that Arabica coffee production in Colombia is highly correlated with the country’s GDP, a fall of their production will decrease the country’s economy because its coffee exports will decrease as well.
Moreover, a fall in price of coffee will impact the income of Colombian farmers because in this country, the coffee harvests are managed by farmers and not by giant coffee plantations operated by multinational corporations such as in Brazil (540’000 families’ farmers).
According to our opinion, an increase of the level of poverty is possible in Colombia. As a conclusion, Colombian coffee farmers would like to sell their coffee beans without being tied to market prices. They would like to set by themselves a price amounted to $1.50 – $1.60 per pound in order to ensure at least the coverage of the production costs.
Details about the factor that impact the Colombian coffee harvest – increase of Brazilian coffee supply
A part of the reason that decreases the global price of coffee is a bumper harvest in Brazil. Indeed, Brazil made a record by producing 62 million bags of coffee beans in 2018 that had increased its supply. A significant information to know is that Brazil produces Arabica and Robusta coffee beans, Colombia produces only Arabica coffee beans. Knowing which type of coffee beans Brazilian coffee producers produce will make clearer how the increase of Brazilian coffee supply had impacted the coffee price at the New York market.
As a whole, an increase of the supply will decrease the price of a commodity and makes it more interesting for buyers. This is what occurred, even if the expected production of Brazilian coffee beans were planned to be 53 million bags for 2019, Brazilian coffee supply would still be considered as a record and would probably keep the coffee price low at the New York market.
Another reason that affects the decrease of the coffee price is the ongoing fall of the Brazilian currency. Coffee is traded in US dollars, Brazilian currency is losing its value at 45% below its 20 year average against the US dollar. As a result, this fall in the currency will strengthen the competitiveness of Brazil against producers in Colombia and Guatemala because the purchasing power of coffee buyers will be higher in Brazil.
Coffee futures/forward curve
Price quotation: USD cent and hundredths of a cent up to two decimal places.
By comparing the historical spot prices of coffee on the graph above and the coffee’s futures/forward curve, we could conclude that the coffee market is currently in contango since the futures/forward curve is upward sloping.
Having the coffee’s forward price higher than the spot price, this means that currently the coffee’s market is a bearish market.
As a conclusion, we would recommend coffee producers to store their coffee beans and to sell with futures or forward contracts.
Coffee and worldwide daily warehouse levels
By using the certified data about the warehouse stock report from ICE – Intercontinental Exchange, we could see that from the beginning of 2019 Brazilian daily warehouse levels were low compared to Colombia. The fact that Brazil reported low inventory level than Colombia demonstrates the interest of the New York market and the roasters (buyers) in buying Brazilian coffee beans which are at a low price.
The second graph shows the “worldwide” daily warehouse stock of coffee beans. The countries included in each total are Brazil, Burundi, Colombia, El Salvador, Guatemala, Honduras, India, Mexico, Nicaragua, Papua New Guinea, Peru, Rwanda and Uganda.
Certified data about the warehouse stock report from ICE – Intercontinental Exchange
Ghana: Dying Cocoa plantation
Let us remember the presentation from Eric Bourgeois (head of cocoa department) at Walter Matter (family owned business, niche market, medium size).
Some Facts on Cocoa:
Coco trees needs : hot, humid, shadow, Tropical regions (in the equatorial region).
Total production 4,65 mio tons.
Cote d’ivoire 2 mio tons (43%),
Ghana 0,9 mio (19%),
Indonesia (0,29 mio, used to be 0,3; 0,4, but reduced by taxes and investment in other commodities more profitable like palm oil),
Ecuador (0,28mio),
Cameroon (0,24mio),
Nigeria (0,23mio)
Main processing countries (semi-finished product)
Cote d’ivoire 0,58 mio
Netherlands 0,55 mio
Indonesia 0,45 mio
Germany 0,41 mio
USA 0,39 mio
Brazil 0,23 mio
Ghana 0,22 mio
News from Ghana
Ghana is the second largest cocoa exporters. However, it could lose its position because of badly managed plantations and drought.
Small farmers growing Cocoa have been using chemical pesticides and fertilizers, and clearing woodland to boost production.
Better planting methods would negate the need for such chemical treatments. NGOs such as SNV, a Dutch organization, are encouraging the farmers to plant shade trees such as banana or Cassava (manioc) trees to keep the cocoa trees cool and reduce the use of water. Moreover, these farmers will be able to increase income since they have bananas and Manioc to sell too.[
Details about the project over there:
Project goal: Modernizing cocoa farming in Ghana by improving growing conditions for new trees and helping farmers to overcome lean times.
Project size: Some 750 farmers are preparing their fields for new trees. Four tree nurseries are being built to grow 600,000 new cacao trees. Approximately 20,000 shade trees will also be planted.
Project partners: SNV Netherlands Development Organisation – Smart Development Works, International Climate Initiative (IKI).
Project budget: The initiative is part of a larger project taking place in Vietnam, Peru and Ghana, which IKI financed with€1,966,384 ($2,243,791).
Sources
Coffee historical price. Market Insider (online). (Consulted on 5thMarch 2019). Available at the URL: https://markets.businessinsider.com/commodities/coffee-price
View of the price fluctuations for the last 3 months:
Measurements: USD per container
In the yearly perspective graph of
the global container index, we can see a drop between 10 December and 24
December 2018. We assume that this drop is connected to Christmas Holiday and the tendency of businesses to order before
this time period to have high level of inventory. Thus, there is not a lot of
delivery at that time right before the holiday, so the demand decreases with
the freight rate accordingly.
One of the major influencers of freight price movement is China as it is one of the largest exporter of goods and importer of commodity. The movement of fluctuation in freight price is affected by the Chinese New Year (“CNY”) which is on the 5th of February with the overall price movement of freight. Chinese people have three weeks of holidays before “CNY” to travel across the country which means most if not all trade activities are stopped during this time.
When looking on the freight price fluctuation for the different
routes, the only freight rate that decreases over the time is the route between
China/East Asia and USA (Pacific) compared
to the others such as Atlantic and Suez route.Even though it is the only route decreasing, it still has an impact on the overall freight index
(decrease of 2%) as China is one of the
most influential players in regards to international trade.
A background factor for the decrease in the price of freight may be the trade war between the US and China, as the barriers to trade increase between these two larger players in the world’s economy. The trade between those two is therefore declining which then results in the decrease of demand for transporting goods. This creates a situation where the supply is higher than demand and which the therefore drives prices down.
Freight rates set to rise in the future
New regulations on sulphur oxide emissions
implemented by the International Maritime Organization 2020 (“IMO 2020”), would
likely increase freight rates. The reduction of sulphur oxide emission is set
to decrease from 3.5% m/m (sour) to 0.5% (sweet) m/m. At this time, fuel costs
already represent more than 50% of total operating costs for the carrier. If
the new regulations would take place, the fuel costs will potentially rise to
around 75% of total costs. This increase in price comes from the fact that now they
will need to buy low sulphur fuel costing more than the fuel with high sulphur
percentage. This is why the IMO took this decision in order to reduce pollution
derived from shipping.