Bulletin 2: NORTH AMERICAN CRUDE & SHALE! What’s NEXT?

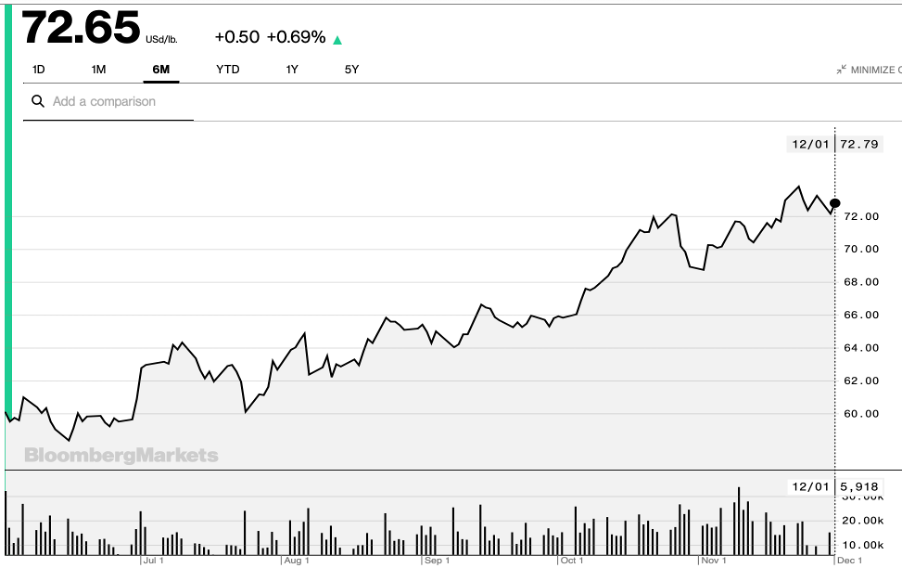
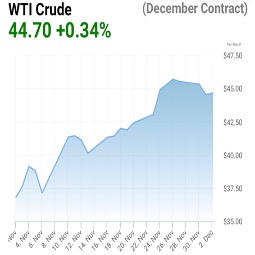
Price movement recap

EIA., [03.12.20]. Cushing, OK WTI Spot Price FOB (Dollars per Barrel). In : [online]. Available at : https://www.eia.gov/dnav/pet/hist/LeafHandler.ashx?n=pet&s=rwtc&f=m

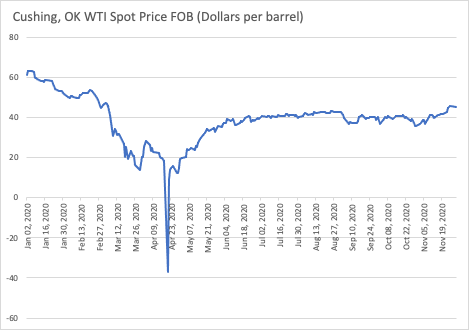
WTI Spot price has remained more or less around USD40/barrel from September to November and now since November 19th we can see an increase in price that reached 45.2 on the 30th of November. This increase in price might be explained by the fact that the economy is slowly recovering and also because of many announcements of potential prospects for vaccines against covid-19 from 2021.

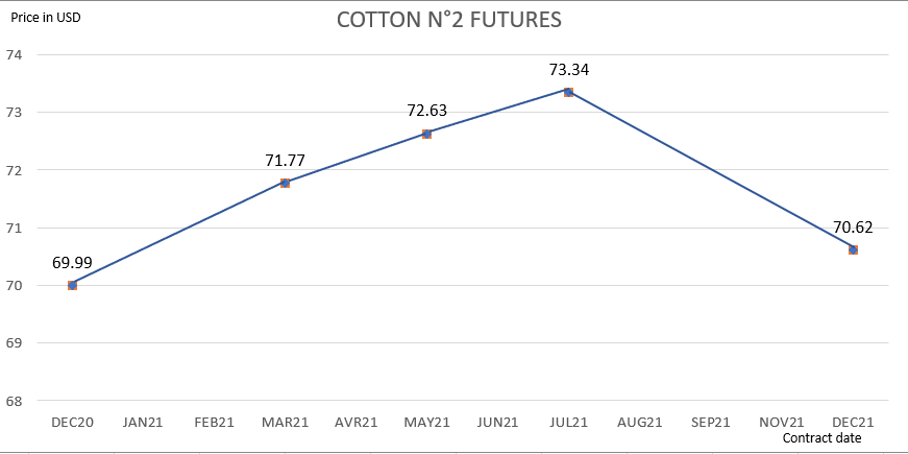
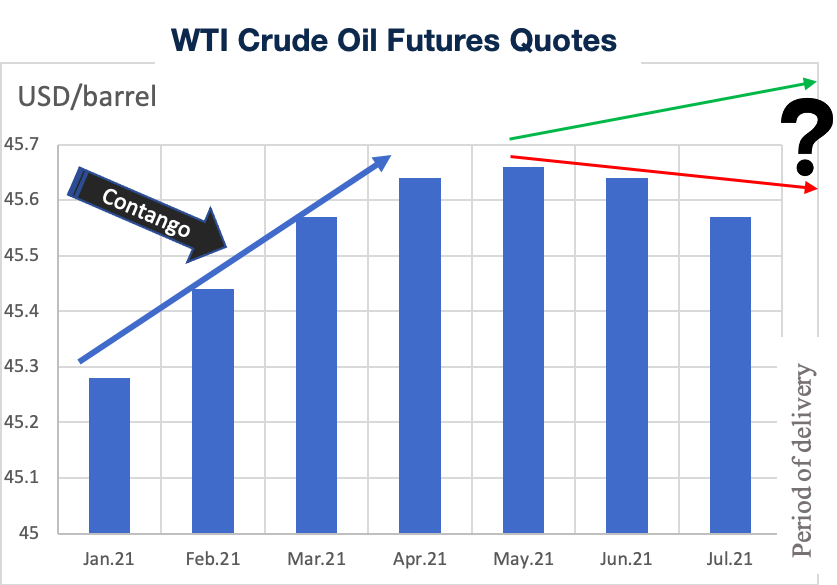
Forward curve 2.12.20

CME GROUP., [09.11.20]. NYMEX WTI Crude Oil Futures & Options. In : [online]. 

Available at : http://www.cmegroup.com/trading/energy/crude-oil/light-sweet-crude.html

The forward curve shows that the market is in contango for the moment which means the spot price for delivery now is lower than today’s price for delivery in future. This means our market is relatively well supplied. Supply is greater than demand now, 

However, as we can see from May 2021, we cannot be sure that the market will remain in a contango situation or will go to backwardation. Indeed, OPEC recently met and agreed to delay their planned increase in production, so there are uncertainties about whether the market will be well supplied or in shortage. If the market underestimates the economic recovery and consequently is faced with a shortage, it would mean that demand is greater than supply. Hence the spot price for delivery now might be higher than the price for delivery in a future period. The demand would send a message to the market: Don’t store! Deliver now!

ANN KOH AND ALEX LONGLEY., [02.12.20]. Oil prices stabilize as OPEC focuses on diplomacy. In : [Online]. [Consulté le 3 décembre 2020]. Available at : https://www.worldoil.com/news/2020/12/2/oil-prices-stabilize-as-opec-focuses-on-diplomacy.

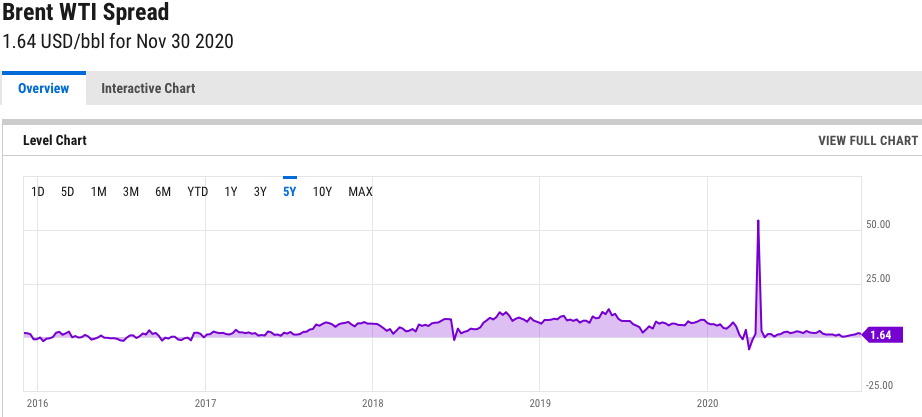
Differential WTI vs Brent: SHALE OIL !

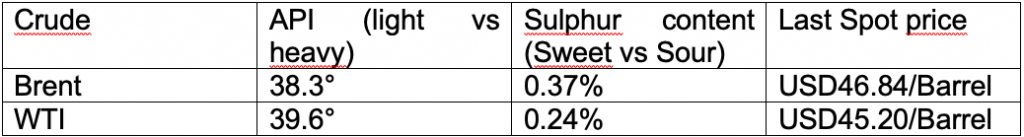
WTI crude oil is shipped by pipeline to Cushing. Its storage site, situated at the far end of Oklahoma, makes it expensive to ship and export in terms of transportation, rendering it primarily processed in the national territory and intended for United states consumption. Pipeline market

Brent crude oil, due to the geographical position of its storage location, which has a deepwater port, large volumes are moved by tankers around the world, reinforcing its relevance as a global reference.Off-shore market.

The main cause of the differential in WTI relative to Brent are due to an excess of light crude oil (SHALE) on the US market and the inability of US refineries to refine it. Since 2015, Ban on exporting US crude is lifted, narrowing the differential. But still, US crude exports are challenging and expensive.

ANON., [10.10.18]. Oil: Why is Brent more expensive than WTI? | Hellenic Shipping News Worldwide. In : [Online]. [Consulté le 3 décembre 2020]. Available at : https://www.hellenicshippingnews.com/oil-why-is-brent-more-expensive-than-wti/

ANON., [03.12.20]. Brent WTI Spread. In : [Online]. [Consulté le 3 décembre 2020]. Available at : https://ycharts.com/indicators/brent_wti_spread.

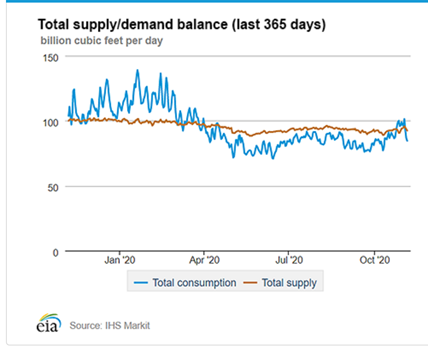
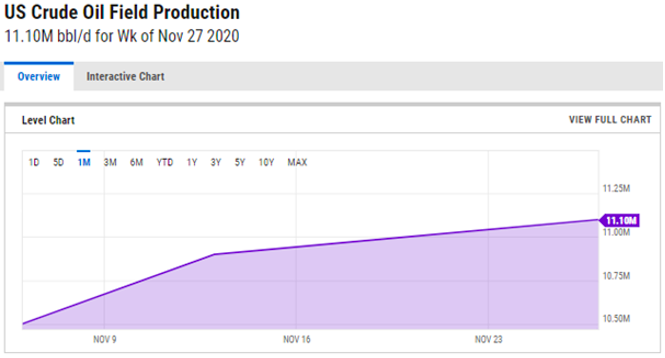
Supply and demand dynamic – Inventory levels

During the week that ended the 20 of November, the American Petroleum Institute (API) has reported the oil production at 11 million barrels per day, it represents a build of 3.8 million barrels in oil inventories.

The following week, an increase in inventories of crude oil of 4.146 million barrels has been reported by the API. Both weeks are above what analysts expected.

ANON., [03.12.20]. US Crude Oil Field Production. In : [Online]. [Consulté le 3 décembre 2020]. Available athttps://ycharts.com/indicators/us_crude_oil_field_production

According to analysts, OPEC+ is likely to extend its current production cuts until January, rather than easing them.

An acceleration in shale drilling would complicate OPEC+’s calculations, but the recovery in U.S. shale drilling “remains modest and aimed at stabilizing production instead, as confirmed by recent earnings comments and a commitment to return cash to shareholders,” Goldman analysts wrote in a note.U.S shale production is expected to decline by 140,000 bpd in December, month-on-month, according to the Energy Information Administration (EIA). The decline is spread between all major shale basins (Permian, Bakken, Eagle Ford, Niobrara, Anadarko)

ANON., [27.11.20]. U.S. Shale Production Continues Its Decline. In : OilPrice.com [online]. [Consulté le 3 décembre 2020]. Available at : https://oilprice.com/Energy/Energy-General/US-Shale-Production-Continues-Its-Decline.html

Recommendations:

December 1st, 2020.

General oil prices were trading down, while the WTI Crude stayed stuck around $40s dollars per barrel. Despite the Covid-19 situation optimism, OPEC ended its 30th November meeting without production plans for 2021. US shale oil output is expected to have a big drop in supply according to the US Energy Information Administration (EIA). Due to the reduction of spending in this production.

Josh Owens., [10.11.20]. Oil Optimism Returns On Fresh Vaccine News | OilPrice.com. In : [Online]. [Consulté le 3 décembre 2020]. Available at : https://oilprice.com/Energy/Energy-General/Oil-Optimism-Returns-On-Fresh-Vaccine-News.html

With the crash in prices due to the demand collapse in early March, the U.S. drillers reduced their spending/production in response to it. Which led to thousands of lost jobs in the sector. The U.S. shale has suffered from the pandemic this year, moreover with the incoming Administration of Joe Biden the shale will again be targeted. As Joe Biden’s promise to ban new oil and gas drilling on federal lands and waters.

Tsvetana Paraskova., [25.11.20]. U.S. Shale Bankruptcies Accelerate Despite Pandemic Protection. In : OilPrice.com [online]. [Consulté le 3 décembre 2020]. Available at : https://oilprice.com/Energy/Energy-General/US-Shale-Bankruptcies-Accelerate-Despite-Pandemic-Protection.html

Compared to our last bulletin where the price was at $42.59 and now raising to $44.70 per barrel (price today for delivery in december) the recommendation was to be long (buy) for the next 3-6 months and still the same as of today. The future consumption of oil is expected to rise continuously throughout the year, since the arrival of the pandemic’s protection. The market being well supplied will be contango. Therefore it will be better to be short (sell) in a future period sometimes next year.

ANON., [2.12.20]. WTI Crude Oil Price Charts. In : OilPrice.com [online]. [Consulté le 3 décembre 2020]. Available at : https://oilprice.com/oil-price-charts

Bulletin N°2 – Cotton – 2020

Price evolution

Available from: https://www.bloomberg.com/quote/CT1:COM

The price of cotton recently almost retrieved its pre-pandemic level. Nevertheless, according to John Robinson, PHD, AgriLife Extension cotton economist this will not last.

Indeed, like most of markets during the pandemic the cotton price fell more than 20 cents, from 70 cents per pound to 49 cents per pound from February to April.

What has helped increase cotton’s price is the fact that the Chinese Government began to buy cotton bales to increase their reserves which has helped to obtain a steady upward price.

Moreover, the US climate was not ideal to produce cotton this year, Many US regions such as Texas and Georgia had droughts, multiple tropical storms followed by freezing temperature. This bad weather triggered price speculator buying cotton, which helped cotton to gain back its price of 70 cents as of November.

Pakistan might also be playing a role in the increase of Cotton’s price. Indeed, Pakistan had many of its agricultural crops in several areas destroyed due to heavy rains, pest attacks and locust invasions. The government is under pressure to bring down price of essential goods and support its textile sector (biggest employer) and is therefore planning to import huge volumes regardless of the rates. The fact that the supply is lower than usual due to the bad weather conditions in several producing country, and that the demand is increasing also explains why the price is moving upward.

Supply & Demand

Available from: https://www.cotlook.com/world-cotton-day-cotton-outlook-feature/

Covid-19 has driven to a collapse in world’s price. According to Cotton Outlook, by the end of 2019/20 the cotton world consumption estimate has fallen from 27million tonnes to below 22 million in just two years. We can see it thanks to the green bars on the graph.

The speed of recovery in consumer demand remains uncertain. The recent apparel imports suffered from a postponed demand as consumers purchases were initially delayed. Furthermore, some lost demand, such as 2020 summer and vacation, clothing school uniforms for some countries, hotel cotton bed sheets and towels, etc, could maybe never be recovered. The remote work and school purchases remains unknown.

Available from: https://www.cotlook.com/world-cotton-day-cotton-outlook-feature/

The production of cotton for 2019/20 was barely affected by the pandemic. Cotton was already picked in the Northern Hemisphere and was already planted in the South. Nevertheless, the volume of cotton unshipped, unconsumed, or unsold was of potentially catastrophic proportions still according to Cotton Outlook. The rise in world stock during 2019/20 was of around 3.9 million tonnes.

The global cotton production is forecasted at 18.6 million for a 480-pound bale. This means that it increases up by 1 percent from November but down by 11 percent from last year. The futures prices shos us that supply and demand should increase, mostly during spring when seeding will begin.

Forward Curve

Prices available from: https://www.theice.com/products/254/Cotton-No-2-Futures/data?marketId=5739902

The December future contract being at its end with 20 cents up, we can see that all cotton futures have slightly increased accordingly. We are still in a contango situation (Price on the 3rd of December 2020: 69.99) and it may still increase if the COVID-19 pandemic stabilizes.

Recommendations

Bad weather condition in several producing countries and the still ongoing COVID-19 pandemic is still affecting the forecast of cotton prices. And with the fact that the futures price is on the rises at least until July 2021 where it will be valued 73.510 we recommend to go long on cotton investment.

Sequeira Reny, Tiago Marques & Nicole Peytregnet

Bibliography

World Cotton Day – Cotton Outlook Feature, [no date]. [online]. [Viewed 1 December 2020]. Available from: https://www.cotlook.com/world-cotton-day-cotton-outlook-feature/

4.5.3-Cotton trading-The fundamentals of cotton supply and demand, [no date]. [online]. [Viewed 1 December 2020]. Available from: https://www.cottonguide.org/cotton-guide/cotton-trading-the-fundamentals-of-cotton-supply-and-demand/

cotton: Cotton exporters hope to resume trade with Pakistan – The Economic Times, [no date]. [online]. [Viewed 2 December 2020]. Available from: https://economictimes.indiatimes.com/markets/commodities/news/cotton-exporters-hope-to-resume-trade-with-pakistan/articleshow/72000396.cms

Cotton No. 2 Futures | ICE, [no date]. [online]. [Viewed 3 December 2020]. Available from: https://www.theice.com/products/254/Cotton-No-2-Futures/data?marketId=5739902

Cotton prices rebound, but supplies high, 2020. AgriLife Today [online]. [Viewed 2 December 2020]. Available from: https://agrilifetoday.tamu.edu/2020/11/10/cotton-prices-rebound-but-supplies-high/

cotton.pdf, [no date]. [online]. [Viewed 1 December 2020]. Available from: https://apps.fas.usda.gov/psdonline/circulars/cotton.pdf

CT1 Commodity Quote – Generic 1st “CT” Future – Bloomberg Markets, [no date]. [online]. [Viewed 1 December 2020]. Available from: https://www.bloomberg.com/quote/CT1:COM

DILAWAR ISMAIL, 2020. Pakistan Steps Up Imports of Farm Goods to Curb Soaring Prices. . 2 October 2020. [Viewed 2 December 2020]. Available from : https://www.bloomberg.com

Global cotton prices increase in October, 2020. [online]. [Viewed 3 December 2020]. Available from: https://www.just-style.com/news/global-cotton-prices-increase-in-october_id140137.aspx

World Cotton Day.pdf, COTLOOK LIMITED, [2020]. . [online]. [Viewed 1 December 2020].Available from : https://www.cotlook.com/world-cotton-day-cotton-outlook-feature/

LNG – Bulletin 2 – 2020

Price movement, demand & supply analysis

We can observe on this graph the price evolution of natural gas spot price over the year 2020. We have to highlight the fact that due to this overall unstable economic situation established with the Covid-19 pandemy, NG and LNG prices drastically decreased and reached a lowest price record achieved. However, we can still observe the seasonality of this commodity through this graph. Indeed, the demand as we have seen increase during the winter time which is reflected on the price. That is to say, in December 2019, we can see that the price went above 2.40 USD/MMBtu and reached this level back in September in 2020 before hitting rock bottom record in the same month. After this, the price raised again according to expectations based on the demand seasonality.

Exportations:

The graph above represents the U.S LNG export from 2018 to 2020 Q2. We can observe that the U.S export of LNG over the year drastically increases in overall. Even though Japan is the world’s biggest importer of LNG accounting with 20% of the global consumption, we can see that South Korea is the main purchaser in the United states, South Korea were making massive effort of consuming cleaner energy (however they have long-planned nuclear and coal plants projects in the coming years-> consumption of LNG is expected to decrease over time). We can see that Korea is closely followed by Japan which uses LNG to generate nearly 40% of its power. In the U.S export the European countries are leading by country such as Spain, France and Netherland which become major importer due to drop in domestic production and coal to gas switching. Concerning the export to Mexico the Sur de Texas-Tuxpan pipeline which was complete in Q4 2019, the U.S. LNG exports to Mexico have been displaced by pipeline flow. Between Q1 and Q2 in 2020 we can see the massive drop for the U.S export globally due to the COVID-19 breakdown combined with a warmer winter affect the demand of LNG.

Forward Curve:

A therm (thm) equals 100’000 British thermal units (Btu).

There are many factors that can affect oil and gas prices. Some of these include the changing dynamics of supply and demand, the amount and cost of storage available, changes in interest rates, fluctuations in foreign exchange rates, the marginal cost of supply, assessment of geopolitical risk and supply shock and the market opinion and expectation and many more influences.

In this case, futures are highly dependent on seasonality of demand and result in a curve that is neither a contango or a backwardation curve but a mix of both depending on the period. We can see that the incentive in January 2021 will be to sell as much as possible whereas in August 2021, the market is telling producers to store. Furthermore, we can observe that prices are to remain stable for the next 7 years as of today. 

Market pressure points:

According to the NGSA, there are mainly 5 types of market pressure points that can influence the price of Natural Gas and thus LNG. Economy, Weather, Demand, Production, Storage are variables that have influence on market pressure. For this winter the forecast on average predict a upward market pressure in the U.S due to the following factors:

Economy: is a vital factor that influences the LNG market. For the current year, the GDP is expected to decline to -2.6 percent. Which will have a downward pressure.

Weather: The National Oceanic and Atmospheric Administration predicted an average winter 4 percent colder than last winter in the United states. This factor will affect consumption and put an upward pressure on the market.

Demand: Customer demand forecast an average 109.5 Bcf/day in 2020/2021 compared with 2019/2020 with an average of 110.6 Bcf/day . In global this will have a neutral pressure on the market.

Supply: NGSA, expected the production to decrease by substantial 9 percent. This will result in a higher price due to the fact that there is a lower supply with a constant demand.

Storage: The start of winter inventory is forecast to be 9 percent above the 5-year average with just over 4 Tcf of gas in storage, considerably more than last winter’s 3.7 Bcf levels. Higher capacity storage will result in a downward pressure on the market in the U.S. 

Recommendation:

Since this coming winter market is expected to go in contango with the analysis made by NGSA, we recommend to store now and sell later the commodity. Furthermore, as we are in the second wave of the COVID-19 LNG market is becoming uncertain as every commodity we can only plan for the coming month.

Bibliography:

National Oceanic and Atmospheric Administration, [no date]. [online]. [Viewed 03 December 2020]. Available from: https://www.noaa.gov/

CHUNG, Jane, 2019. South Korea’s LNG imports to fall on new nuclear, coal plants. Reuters [online]. 31 October 2019. [Viewed 03 December 2020]. Available from: https://www.reuters.com/article/us-southkorea-lng-power-analysis-idUSKBN1XA0LJ

NGSA, [no date]. [online]. [Viewed 03 December 2020]. Available from:

https://www.ngsa.org/wp-content/uploads/sites/3/2020/09/NGSA-PowerPoint-2020_2021-Winter-Outlook-for-Natural-Gas.pdf

Reduced LNG demand delays FIDs, 2020. LNG Industry [online]. [Viewed 03 December 2020]. Available from: https://www.lngindustry.com/liquid-natural-gas/09112020/reduced-lng-demand-delays-fids/

UK Natural Gas Futures Curve, [no date]. ERCE [online]. [Viewed 03 December 2020]. Available from: https://www.erce.energy/graph/uk-natural-gas-futures-curve/

Henry Hub Natural Gas Spot Price, [no date]. [online]. [Viewed 03 december 2020]. Available from: https://ycharts.com/indicators/henry_hub_natural_gas_spot_price