
Source : bloomberg
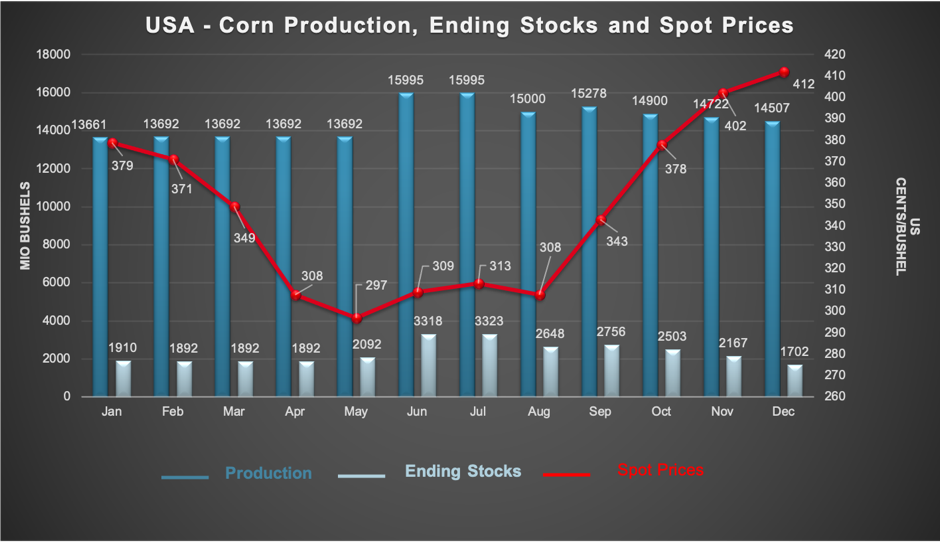
PRICE
The strong demand from China has resulted in higher maize price over the past several months.
PRODUCTION
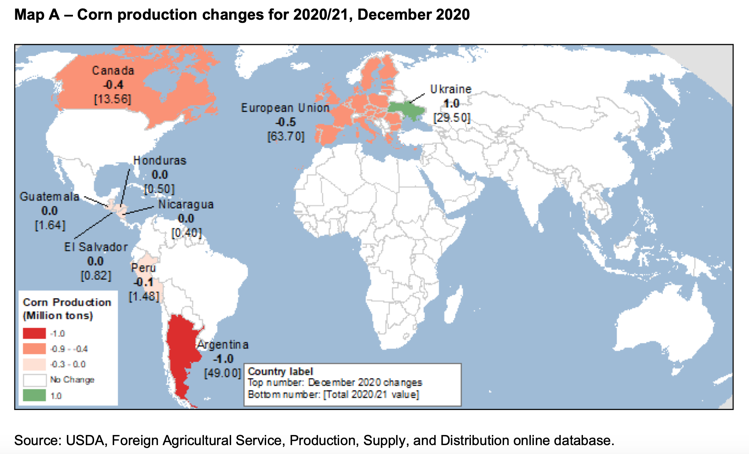
World maize production for 2020/2021 is forecast to a total of 1,143.6 million MT, down 1.1 million MT from the November forecast.
Argentina is suffering the consequences and the drought of “La Niña”. In fact, the area devoted to corn is expected to decrease by 2% compared to last month, from 50 million tons to 49 million tons. This is accounting for the largest decrease in production this month. The corn production in the EU has decreased by 0.5 million MT to 63.7 million MT because they experienced dry conditions during important parts of the crop development cycle in particular, in Bulgaria.
In the past Bulletin we saw that the corn production in Ukraine (4th largest exporter) for 2020/2021 has suffered from a severe drought which badly affected the production. This month corn production for 2020/21 has increased by 1.0 million MT from the previous month, compensating for some of the global declines. But the gap is still huge compared to last year -14%.
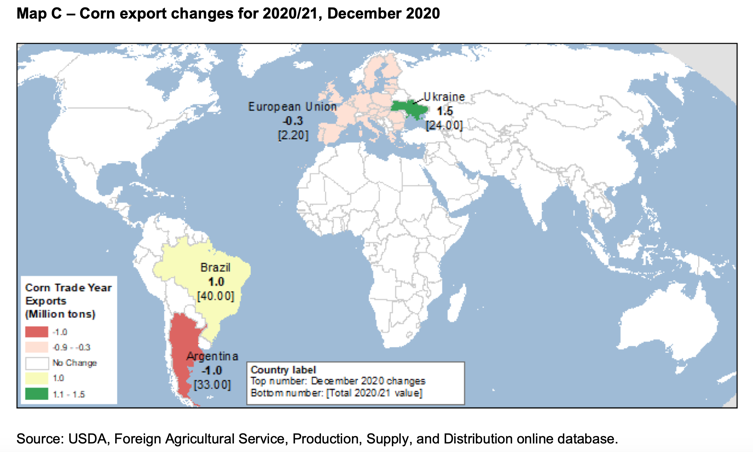
DEMAND
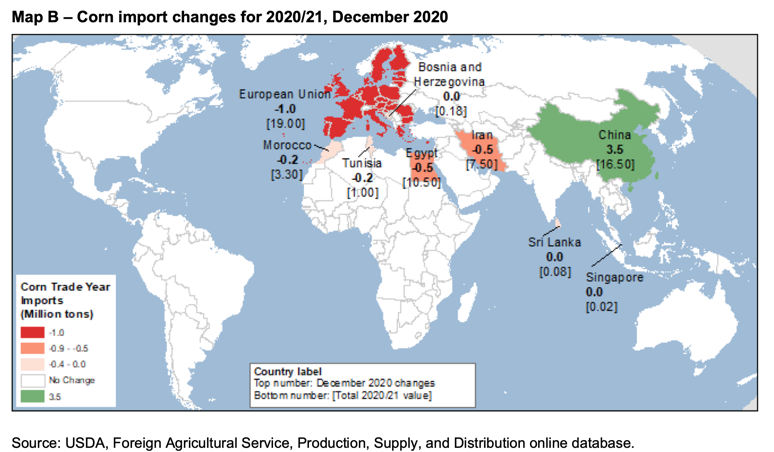
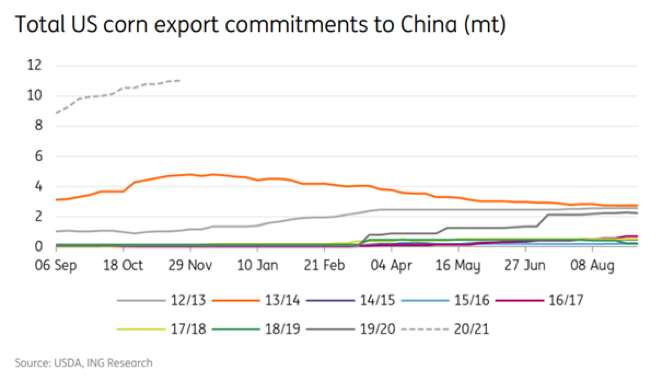
Despite the expected slowdown in feed usage due to COVID-19, several countries imported record volumes of corn in 2020. Corn imports are expected to increase in 2021 of 7% from last year’s record. This increase is largely due to China. China has been engaged since mid-year in securing corn and some substitutes (sorghum and barley) to meet the increasing demand for feed in the livestock sector.According to USDA International Agriculture Services, China’s corn imports are expected to triple to 22 million tons this season.
Total imports of maize from China increased by 3.5 million MT to 16.5 million this month. The main explanation for China’s increased demand for corn for animal feed is that pigs’ herds in China are beginning to recover from the African swine fever. One of their key resources are pigs, so the government has made the increasing of pork’s production in the country a high priority.
Globally, China’s increased imports of maize are offset in part by lower imports from several other major import markets.
Corn imports are subject to the tariff quota set by the World Trade Organization on a calendar year basis, but imports are already above the quota of 7.2 million tons only with the January-October period.
There is a trade war between the two big players but if we take a closer look, the relationship between the U.S. and China was never better, and the quantity of imports/exports of corn was never as considerable as it is now. Corn has risen to nearly 30% of US export sales.
China has submitted a draft law to ensure national food security and to reform the management of the key grain reserves in China. This project also includes the United States. Indeed, Trump had made an agreement with China for “phase 1”, which includes commitment purchases by China of agricultural products in 2020-2021.
ENDING STOCK
As we explain above the demand is superior to the supply side. The overall decrease for corn production and the growing demand from China lead to an urgent need for the ending stock. The production was estimated lower than the last month we lost almost 1million tons mainly caused by Argentina. Even if the South American countries did not suffer from the climate, the other producer countries (North hemisphere), registered a lower production and the harvest period is almost over now. The consumption is estimated to increase for 1.5 millions tons this month compared to November, largely sustained by China. The consumption in a month has increased to 2.5 millions tons. With a basic calculation we found that the demand exceeds the supply side to 14.5millions tons and that is why we assist to a decrease in ending stock. From November the ending stock lost almost 2.5 millions tons. All these factors explain the positive fluctuation for corn price.
FORWARD CURVE
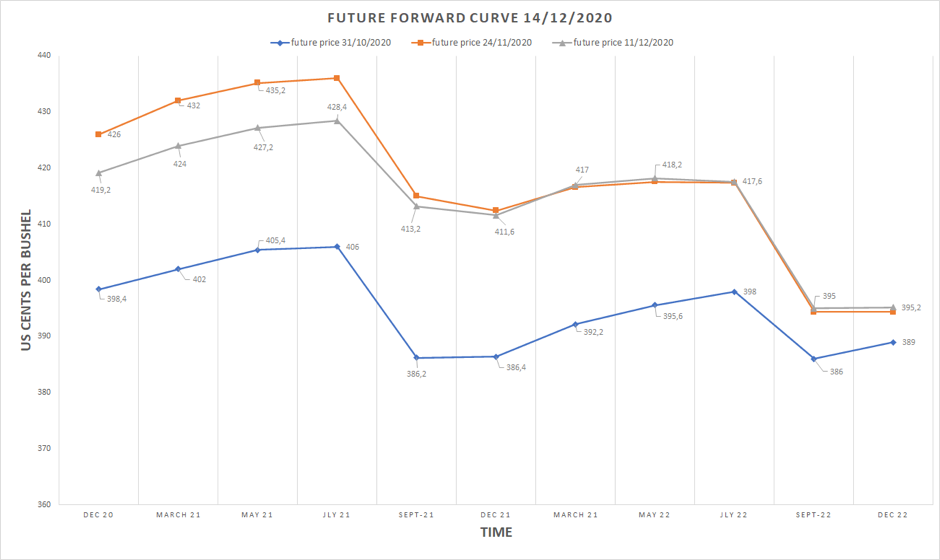
The shape of the forward curve for our three bulletins are almost identical due to seasonality. It is a normal curve (it is well supplied) from december to july (the message is to store) and goes into an inverse curve (the demand is hot) from july to december (the message is to deliver).
The prices agreed on the 11th of December are lower than the price agreed on the 24th of November for the seven upcoming contracts.
It is odd because supply decreases this month and demand increases which would normally result in higher price for the spot and future. We think that it is because the supply has decreased a lot because of Ukraine and the demand increased because of China resulting in higher prices agreed on the 24th November. And for the price agreed on the 11th of December, the supply of Ukraine increased from last month. It can also be hypothesized that the market overreacted last month. One of the reasons for this strong reaction is that the gap between production and demand between October and November tripled from almost -4 million tons (=lack of supply) to -12 million tons (+300% increase). Whereas this month we went from -12 to -14.5 million tons (20.8%).
RECOMMENDATION
As mentioned above, supply decreased this month and there is an increase in the demand from China. The gap between supply and demand has increased by 2.5Millions tons since last month. Therefore we assume that the spot price will increase too. We are still on a normal curve this month. Furthermore, the news of COVID-19 vaccine and the end of the lockdown in some countries will reassure the economics agents. Our recommendation from a trader point of view is to buy physically in the spot market, and sell futures on a later date if the slope is sufficient to overlap the storing and financing costs. The trader will make profit thanks to his benefit from the physical result and paper result.
Léo Millet, Maike Da Silva, Patrice Correia Cardoso & Cassandra Kirchhoff
SOURCE
cmd-strong-chinese-agri-purchases-likely-to-continue-in-2021.pdf, [sans date]. [en ligne]. [Consulté le 17 décembre 2020]. Disponible à l’adresse : https://think.ing.com/downloads/pdf/article/cmd-strong-chinese-agri-purchases-likely-to-continue-in-2021
Corn | USDA Foreign Agricultural Service, [sans date]. [en ligne]. [Consulté le 17 décembre 2020]. Disponible à l’adresse : https://www.fas.usda.gov/commodities/corn
Corn Futures Settlements – CME Group, [sans date]. [en ligne]. [Consulté le 17 décembre 2020]. Disponible à l’adresse : https://www.cmegroup.com/content/cmegroup/en/trading/agricultural/grain-and-oilseed/corn_quotes_settlements_futures.html
grain__1_.pdf, [sans date]. [en ligne]. [Consulté le 17 décembre 2020]. Disponible à l’adresse :https://downloads.usda.library.cornell.edu/usda-esmis/files/zs25x844t/5425m323c/ns064z89z/grain__1_.pdf
grain.pdf, [sans date]. [en ligne]. [Consulté le 17 décembre 2020 a]. Disponible à l’adresse :https://apps.fas.usda.gov/psdonline/circulars/grain.pdf
grain.pdf, [sans date]. [en ligne]. [Consulté le 17 décembre 2020 b]. Disponible à l’adresse :https://downloads.usda.library.cornell.edu/usda-esmis/files/zs25x844t/7h14bd24q/gq67kf77r/grain.pdf
grain.pdf, [sans date]. [en ligne]. [Consulté le 17 décembre 2020 c]. Disponible à l’adresse :https://downloads.usda.library.cornell.edu/usda-esmis/files/zs25x844t/6w925260x/8049gw97t/grain.pdf
International Grains Council, [sans date]. [en ligne]. [Consulté le 17 décembre 2020]. Disponible à l’adresse :https://www.igc.int/en/markets/marketinfo-sd.aspx
Latest News | S&P Global Platts, [sans date]. [en ligne]. [Consulté le 17 décembre 2020]. Disponible à l’adresse : https://www.spglobal.com/platts/en/market-insights/latest-news
McConnell et Olson – 2020 – No Changes to the 202021 U.S. Corn Market Outlook.pdf, [sans date]. [en ligne]. [Consulté le 17 décembre 2020]. Disponible à l’adresse :https://www.ers.usda.gov/webdocs/outlooks/100046/fds-20l.pdf?v=5690.1
production.pdf, [sans date]. [en ligne]. [Consulté le 17 décembre 2020]. Disponible à l’adresse :https://apps.fas.usda.gov/psdonline/circulars/production.pdf
snd_cbt.pdf, [sans date]. [en ligne]. [Consulté le 17 décembre 2020]. Disponible à l’adresse :https://www.cmegroup.com/trading/agricultural/files/ht_charts/snd_cbt.pdf
wasde1220.pdf, [sans date]. [en ligne]. [Consulté le 17 décembre 2020]. Disponible à l’adresse :https://www.usda.gov/oce/commodity/wasde/wasde1220.pdf