
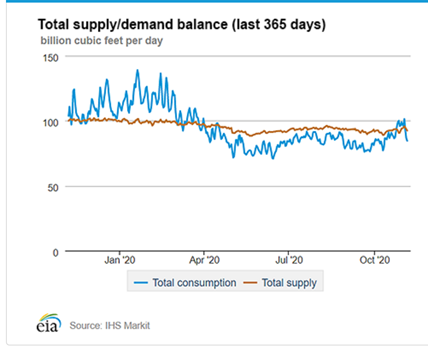
Price movement, demand & supply analysis

We can observe on this graph the price evolution of natural gas spot price over the year 2020. We have to highlight the fact that due to this overall unstable economic situation established with the Covid-19 pandemy, NG and LNG prices drastically decreased and reached a lowest price record achieved. However, we can still observe the seasonality of this commodity through this graph. Indeed, the demand as we have seen increase during the winter time which is reflected on the price. That is to say, in December 2019, we can see that the price went above 2.40 USD/MMBtu and reached this level back in September in 2020 before hitting rock bottom record in the same month. After this, the price raised again according to expectations based on the demand seasonality.
Exportations:
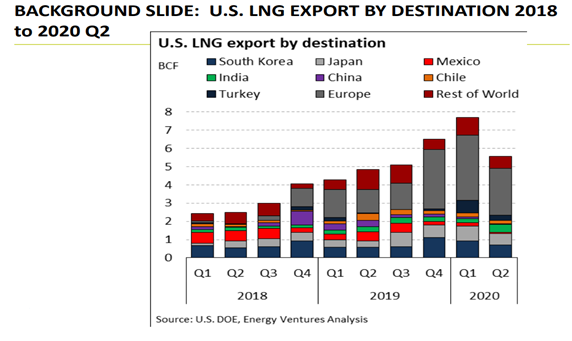
The graph above represents the U.S LNG export from 2018 to 2020 Q2. We can observe that the U.S export of LNG over the year drastically increases in overall. Even though Japan is the world’s biggest importer of LNG accounting with 20% of the global consumption, we can see that South Korea is the main purchaser in the United states, South Korea were making massive effort of consuming cleaner energy (however they have long-planned nuclear and coal plants projects in the coming years-> consumption of LNG is expected to decrease over time). We can see that Korea is closely followed by Japan which uses LNG to generate nearly 40% of its power. In the U.S export the European countries are leading by country such as Spain, France and Netherland which become major importer due to drop in domestic production and coal to gas switching. Concerning the export to Mexico the Sur de Texas-Tuxpan pipeline which was complete in Q4 2019, the U.S. LNG exports to Mexico have been displaced by pipeline flow. Between Q1 and Q2 in 2020 we can see the massive drop for the U.S export globally due to the COVID-19 breakdown combined with a warmer winter affect the demand of LNG.
Forward Curve:
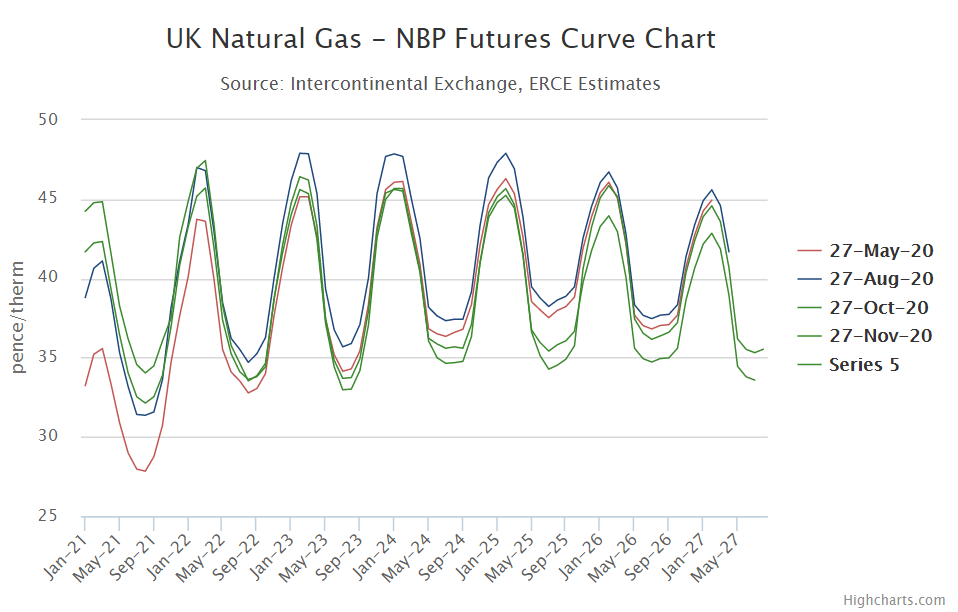
A therm (thm) equals 100’000 British thermal units (Btu).
There are many factors that can affect oil and gas prices. Some of these include the changing dynamics of supply and demand, the amount and cost of storage available, changes in interest rates, fluctuations in foreign exchange rates, the marginal cost of supply, assessment of geopolitical risk and supply shock and the market opinion and expectation and many more influences.
In this case, futures are highly dependent on seasonality of demand and result in a curve that is neither a contango or a backwardation curve but a mix of both depending on the period. We can see that the incentive in January 2021 will be to sell as much as possible whereas in August 2021, the market is telling producers to store. Furthermore, we can observe that prices are to remain stable for the next 7 years as of today.
Market pressure points:
According to the NGSA, there are mainly 5 types of market pressure points that can influence the price of Natural Gas and thus LNG. Economy, Weather, Demand, Production, Storage are variables that have influence on market pressure. For this winter the forecast on average predict a upward market pressure in the U.S due to the following factors:
Economy: is a vital factor that influences the LNG market. For the current year, the GDP is expected to decline to -2.6 percent. Which will have a downward pressure.
Weather: The National Oceanic and Atmospheric Administration predicted an average winter 4 percent colder than last winter in the United states. This factor will affect consumption and put an upward pressure on the market.
Demand: Customer demand forecast an average 109.5 Bcf/day in 2020/2021 compared with 2019/2020 with an average of 110.6 Bcf/day . In global this will have a neutral pressure on the market.
Supply: NGSA, expected the production to decrease by substantial 9 percent. This will result in a higher price due to the fact that there is a lower supply with a constant demand.
Storage: The start of winter inventory is forecast to be 9 percent above the 5-year average with just over 4 Tcf of gas in storage, considerably more than last winter’s 3.7 Bcf levels. Higher capacity storage will result in a downward pressure on the market in the U.S.
Recommendation:
Since this coming winter market is expected to go in contango with the analysis made by NGSA, we recommend to store now and sell later the commodity. Furthermore, as we are in the second wave of the COVID-19 LNG market is becoming uncertain as every commodity we can only plan for the coming month.
Bibliography:
National Oceanic and Atmospheric Administration, [no date]. [online]. [Viewed 03 December 2020]. Available from: https://www.noaa.gov/
CHUNG, Jane, 2019. South Korea’s LNG imports to fall on new nuclear, coal plants. Reuters [online]. 31 October 2019. [Viewed 03 December 2020]. Available from: https://www.reuters.com/article/us-southkorea-lng-power-analysis-idUSKBN1XA0LJ
NGSA, [no date]. [online]. [Viewed 03 December 2020]. Available from:
Reduced LNG demand delays FIDs, 2020. LNG Industry [online]. [Viewed 03 December 2020]. Available from: https://www.lngindustry.com/liquid-natural-gas/09112020/reduced-lng-demand-delays-fids/
UK Natural Gas Futures Curve, [no date]. ERCE [online]. [Viewed 03 December 2020]. Available from: https://www.erce.energy/graph/uk-natural-gas-futures-curve/
Henry Hub Natural Gas Spot Price, [no date]. [online]. [Viewed 03 december 2020]. Available from: https://ycharts.com/indicators/henry_hub_natural_gas_spot_price