
World’s corn and wheat production is bigger-than-expected while Australia is drying up!
WHEAT:
Australian Wheat:
Australia will import its first shipment of wheat in 12 years as a drought dramatically decreased the output of the grain world’s fourth largest exporter forcing it to buy cargoes from Canada. Many farmers have been forced to delay planting or to choose to sow into dry soils with a higher risk of crop failure. Australia’s forecasters announced in March that production would rally 40 percent however little rains, private forecasters trimmed their estimates. Australia’s traditional customers such as Indonesia (the world’s second biggest importer of wheat) have turned to Russia and Ukraine to buy record volumes.
World’s Wheat:
The Black Sea region, Europe and North America are expecting an increased production (bigger than expected) for the 2019/20 crop which will be harvest around the middle of this year, likely depressing prices.
Trade war and USDA’s aid to farmers:
The USDA recently paid 8.52 billion dollars to farmers designed to offset losses from trade tariffs by China and as talks fell short last week, the Trump administration is working on a second aid program to support farmers. The commodities that received aid were of course soybeans and, corn, wheat, cotton and sorghum.
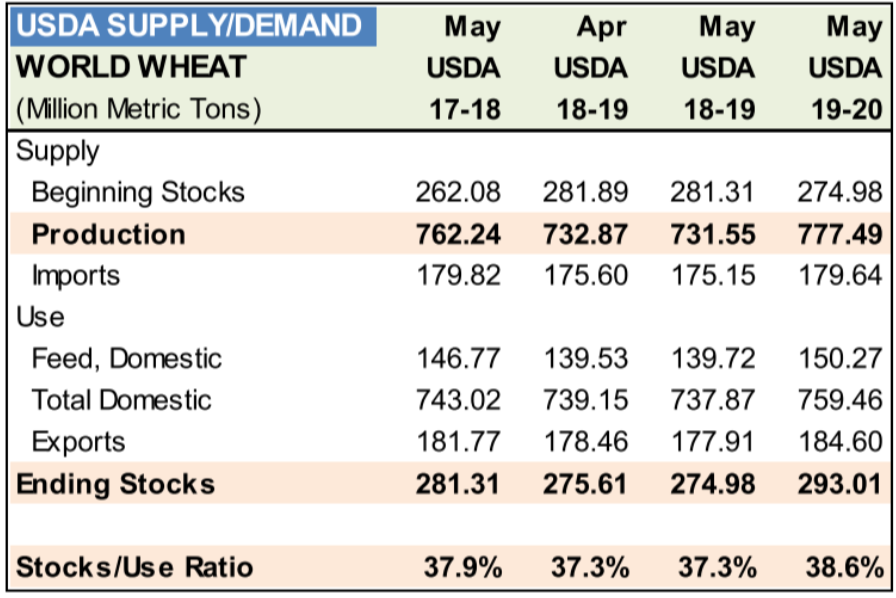
Wheat global production is also high
As shown in the graph, the expected production of wheat for the harvest 19/20 is higher than the 2 past years with 777.49 mio MT for 19/20, 731.55 mio MT for 18/19 and 762.24 for 17/18.
This has result of a current ending stock higher than usual with 293 mio MT.
Many different producing countries are currently having trouble to sell their grains such as the US. Indeed, Dan Roose, president of the US commodities said “We’re swimming in grain.”
US corn grower are currently facing financial difficulties
As previously explained, many farmer in the US are highly impacted by the trade war between China and the US.
Due to this situation, US corn growers are putting pressure on Trump for a better traitement of his USD 15bio China trade aid plan.
To face this issue, M. Trump has previously made a consequent subsidy to his farmer of 8.52 billion of USD. However, the National Corn Growers Association sent out a call to action urging farmers to tell Trump that the 1 cent-per-bushel payment that growers received under the prior market facilitation payments wasn’t enough.
Trump has announced on Friday that he will take in consideration the opinion of the farmers. He has recently asked the Agriculture Secretary Sonny Perdue to work on a plan for solving this issue.
Corn supply remains stronger than previous years even with the US recent flood problems
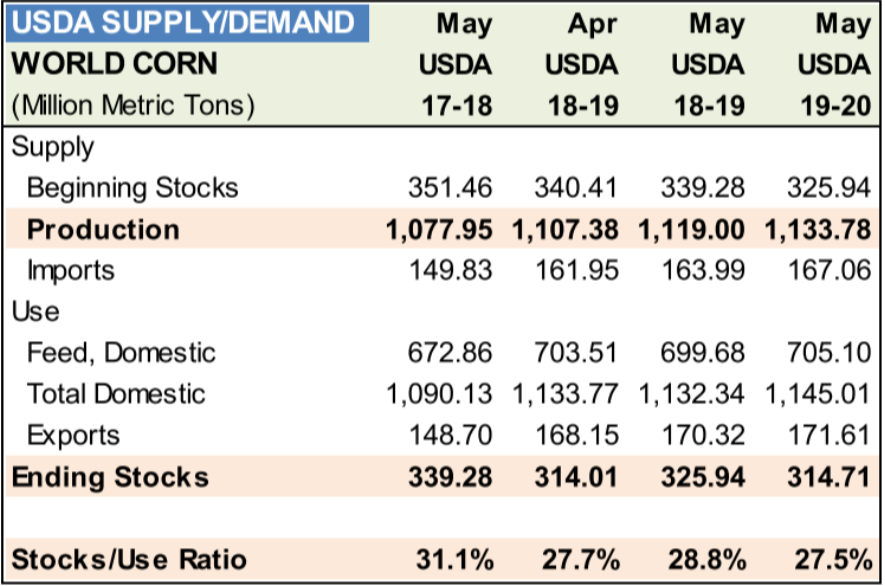
Even though the recent problem in flood in the US which was supposed to lead to a decrease in the future crops, it seems that the production has slightly risen from 1’119 Mio MT in may 18-19 to 1’133 mio MT in may 19-20 in the world. The US hasn’t been really impacted by the recent floods and has done even better than last year. On a world basis it seems that most countries are doing well with the production of corn except Ukraine which has increased the quantity planted of Wheat and decrease the amount planted of corn.
The Ending stock of corn remains in the average in comparison from last years. It is 2 months before the harvest period of corn which happens from July to september.
Trader point of view
From a trader’s point of view, because there is an increase in production compared to last year, prices for the next harvest have decreased. So, trading companies have interest to sell their stock and are actively concerned by this price change, because they have bought their products more expensive than they are currently worth. And if we compare last year’s prices at the same time, we see that there is a very clear loss. For example, the spot price approximately worth 440 cent per bushel last year compared to 376 at the same time last year for corn.
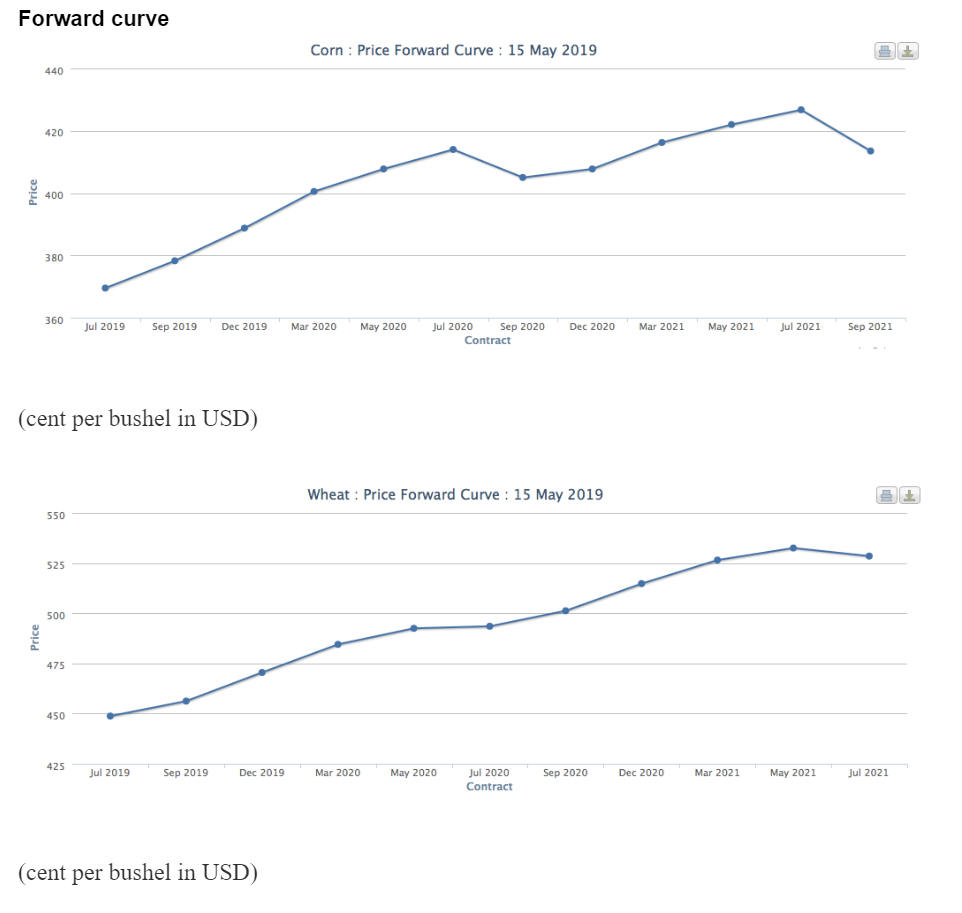
As you can see above, forwards curves for wheat and corn are quite special as they are always/often in contango.
This fact is due that it has to always cover the cost of carry to give the incentive to the farmer to keep growing this agricultural product. May to July are the only months when the contango becomes less steep for wheat.
This is due to the harvest period and the market is full of new crop. However for the corn, it is from July to September that the supply become huge and takes over the demand.
Finally, when the market become more bullish as the demand is higher, the forward curve becomes in backwardation. This feature is very typical for agricultural goods.
https://www.cmegroup.com/trading/agricultural/files/ht_charts/grnxpts_cbt.pdf
https://www.reuters.com/article/us-usa-china-trade-farmers/u-s-farmers-receive-8-52-billion-in-aid-to-date-usda-says-idUSKCN1SL1ZN
https://www.reuters.com/article/australia-wheat/australia-to-import-first-wheat-in-12-years-as-drought-bites-idUSL4N22R07N
https://www.reuters.com/article/usda-crops/update-2-usda-says-grain-supplies-to-remain-massive-in-new-crop-year-idUSL2N22M15V