
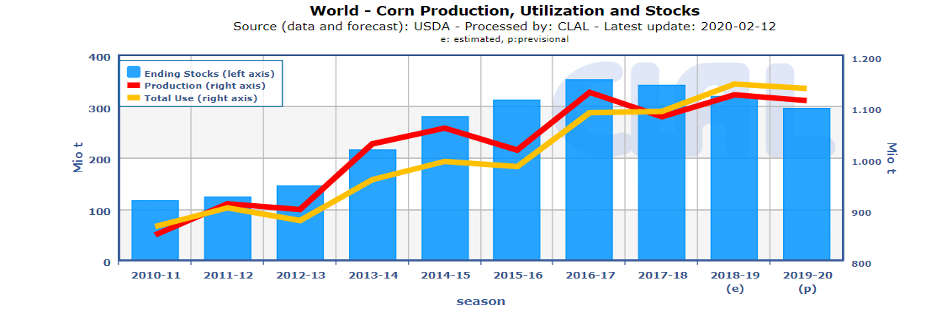
Overview of corn market on the last 15 years
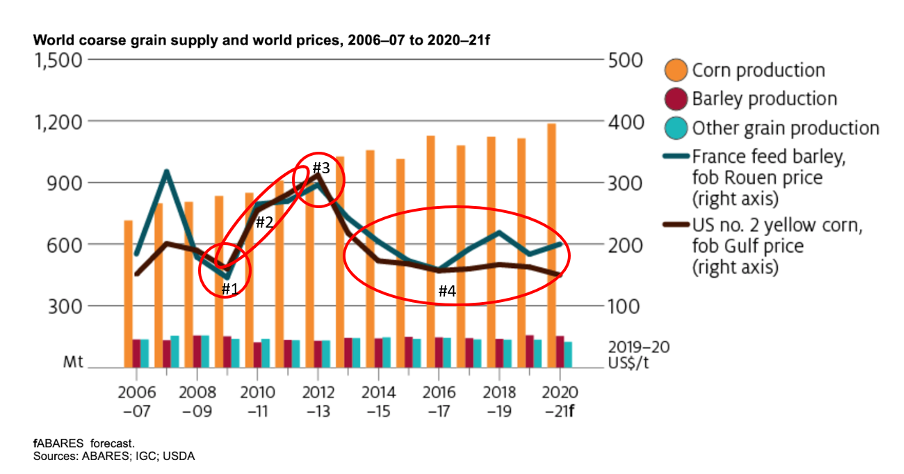
Source : https://www.agriculture.gov.au/abares/research-topics/agricultural-outlook/coarse-grains
-#1 In 2008, the financial crisis caused the prices to fall.
-#2 In 2006-2011, the ethanol production doubled (strong demand for ethanol).
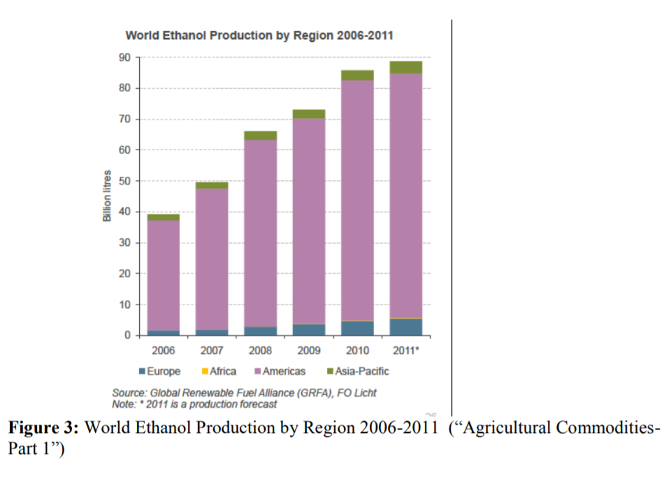
Source : https://www.uwlax.edu/globalassets/offices-services/urc/jur-online/pdf/2012/rattray.jennifer.pdf
-#3 In 2012, there was severe dryness in the USA, (USA, largest producers and exporters, had to import 5 times more than the 2 previous years. The importation was 160 million bushel against 28-29 million in 2010-2011.
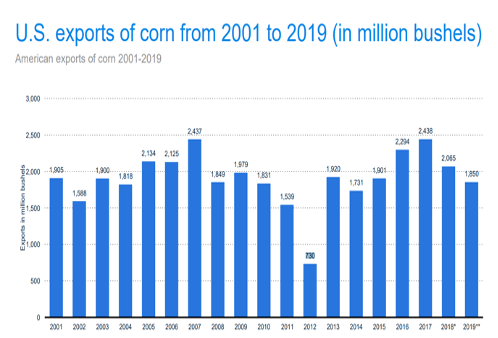
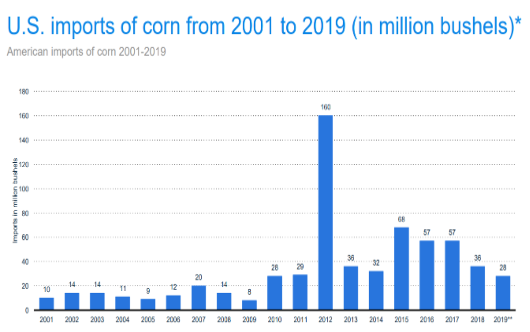
Source : statista, from USDA, economic research service.
-#4 Between 2012 and 2017, the production was higher than demand and at the same time stocks were increasing resulting in low prices. Since 2017, demand has become higher than supply. To satisfy this demand, it was necessary to use the stocks. Therefore, the stocks decreased and it explains that the impact on price was quite low.
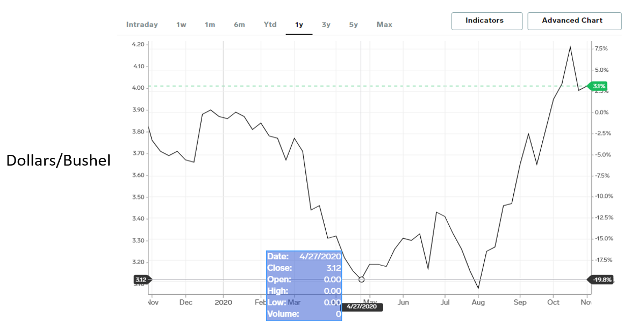
How has evolved the price through the current year
Corn prices in USD/Bushel (last update 4/11/2020)
Source :https://markets.businessinsider.com/commodities/corn-price
On this chart we can see that the price collapsed in the first months of the year, mainly caused by the covid-19. The lockdown in many countries led to a collapse of diesel and gasoline demand and ethanol is no exception. The production has fallen and decreased by almost 50%. And we know that more than 1/3 of corn production is used to make ethanol. After that, we can see that the price started to increase linked to the end of the first wave of covid-19. And when we approach August the price tends to increase. The explanation is climate in the US; a storm in Iowa (the main state to produce corn in the US) has damaged the crop. We can also add the low rainfall in the corn belt during the month of August. All these events have affected the quality and the quantity of corn.
World corn prices
The world price of corn is forecast to drop by 8% to US$150 per tonne in 2020-21, representing the lowest price since 2006-07. The fall in the price is due to a record global planting and expectations of record average yields. The mixed outlook for demand due to the COVID-19 pandemic worsened the impact of record production on prices.
Global production
Global corn production is expected to reach 1.2 billion tonnes in 2020-2021, an increase of 6.5% over the previous year. Corn production is forecast to reach record peaks in the United States and Brazil. An almost record production is also forecast in China, backed by favourable seasonal conditions.
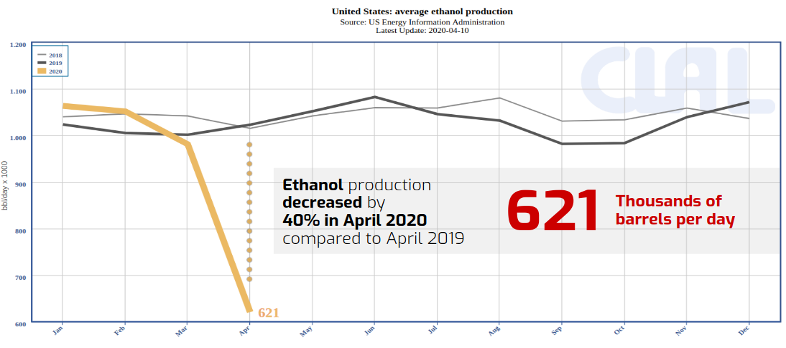
Global demand
Because of the ongoing COVID-19 impact, the global demand outlook for corn remains unclear. As a consequence of COVID-19 measures, industrial and food use of corn is expected to decline in 2020.
Also due to COVID-19 impacts on travel, the use of corn for bioethanol in the United States decreased by 8 % compared to the previous year.It is also expected that the use of corn as food will have decreased over the COVID-19 period, due to ongoing disruptions to the food service industry.
On the other hand, despite the ongoing impact of COVID-19, the use of corn as animal feed is expected to increase.
As we are still in this COVID-19 period and potential future waves of it still represent a big risk for the industrial and food use of corn.
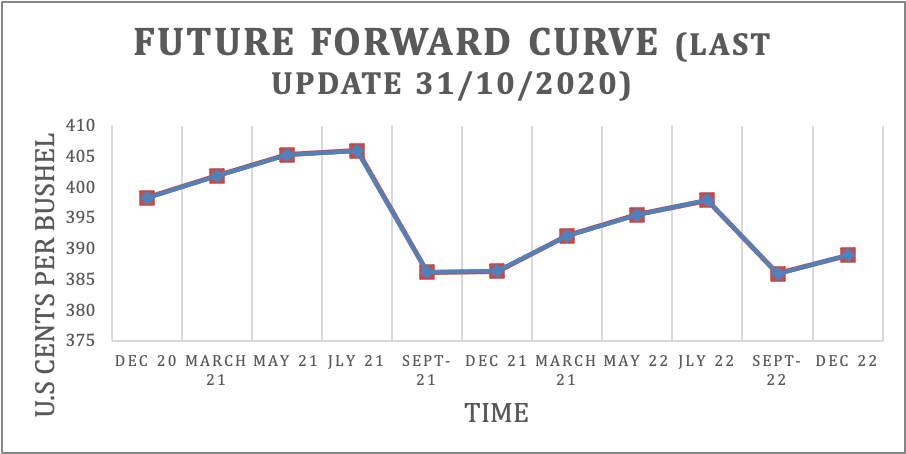
Forward curve
Source : https://www.cmegroup.com/trading/agricultural/grain-and-oilseed/corn_quotes_settlements_futures.html
From December ‘20 to July ‘21, it is a normal curve. Then, it goes into an inverse curve until September ‘21. From September ‘21 to july ‘22 it goes into a normal curve again and then falls into an inverse curve and goes back to a normal curve again. We can see a pattern here. Indeed, it is a normal curve (the market is well supplied) but always drops into an inverse curve between July and September which is due to the harvest period for the two main producers, USA and China. Prices reflect the seasonal breakdown of supply.At this time, the supply/demand is in favor of demand.
From December to July, the message is to store because the demand doesn’t need as much. From July to September, the message is to deliver (don’t store) because the demand is willing to pay for it.
Recommendation
We prefer to give a recommendation for 3 months because of the uncertainty due to COVID-19. Indeed, the situation is constantly changing. The recommendation is to go short for the 3 upcoming months based on the price’s forecast.
Patrice Correia Cardoso, Maike Da Silva, Léo Millet & Cassandra Kirchhoff
SOURCES
CLAL, [sans date]. TESEO – Corn and Soybean: world market trends. [en ligne]. [Consulté le 5 novembre 2020]. Disponible à l’adresse : https://teseo.clal.it/en/index.php?section=maisesoia&utm_source=teseo&utm_medium=website&utm_campaign=menuEN
Coarse grains: September quarter 2020 – Department of Agriculture, [sans date]. [en ligne]. [Consulté le 5 novembre 2020]. Disponible à l’adresse : https://www.agriculture.gov.au/abares/research-topics/agricultural-outlook/coarse-grains
Corn Futures Settlements – CME Group, [sans date]. [en ligne]. [Consulté le 5 novembre 2020]. Disponible à l’adresse : https://www.cmegroup.com/content/cmegroup/en/trading/agricultural/grain-and-oilseed/corn_quotes_settlements_futures.html
Find information for Corn Futures Settlements provided by CME Group. View Settlements GILBERTIE, Sal, [sans date]. Corn And Soybean Prices Are Often Lowest During The October Harvest. Forbes [en ligne]. [Consulté le 5 novembre 2020]. Disponible à l’adresse : https://www.forbes.com/sites/salgilbertie/2020/10/06/corn-and-soybean-prices-are-often-lowest-during-the-october-harvest/
NYSTROM, Phyllis, [sans date]. Grain Outlook: USDA misses 2019-20 corn stocks by 205 million bushels. TheLandOnline [en ligne]. [Consulté le 5 novembre 2020]. Disponible à l’adresse : https://www.thelandonline.com/news/grain-outlook-usda-misses-2019-20-corn-stocks-by-205-million-bushels/article_a44435d6-0a5a-11eb-ae12-bfc2f3f76440.html
USDA, [sans date]. [en ligne]. [Consulté le 5 novembre 2020]. Disponible à l’adresse : https://www.usda.gov/
Rattray – 2012 – The Implications of the Increasing Global Demand f.pdf, [sans date]. [en ligne]. [Consulté le 5 novembre 2020]. Disponible à l’adresse : https://www.uwlax.edu/globalassets/offices-services/urc/jur-online/pdf/2012/rattray.jennifer.pdf