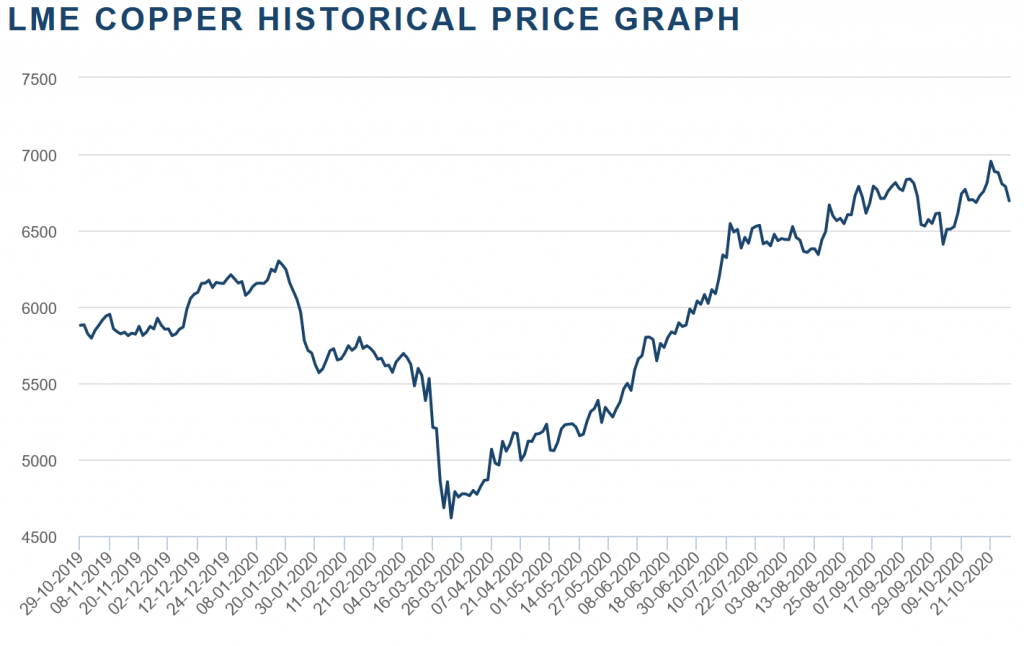
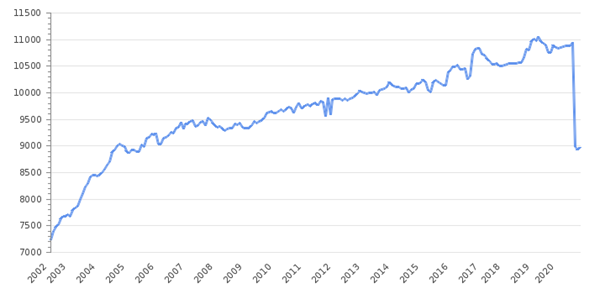
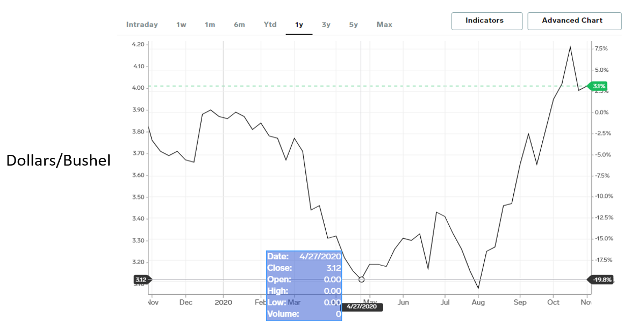
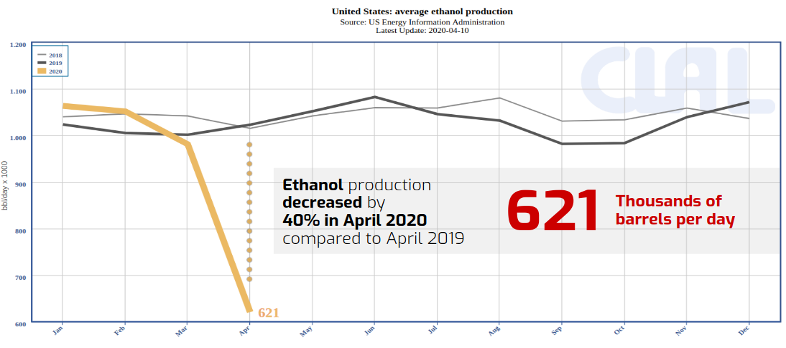
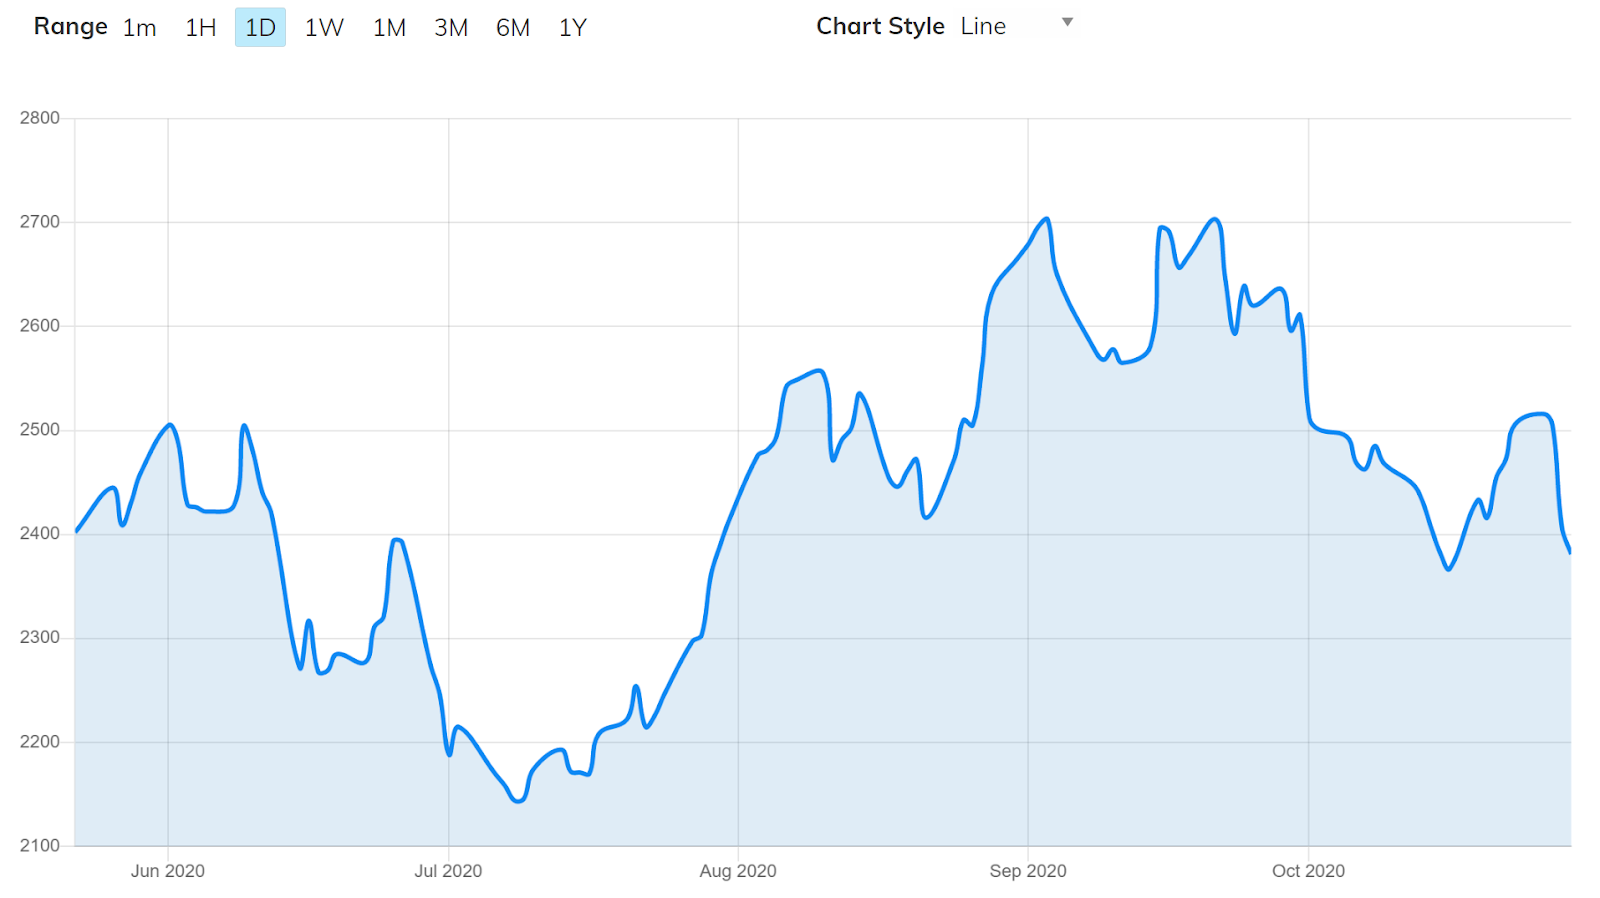
PRICE MOVEMENT RECAP
Price in USD per bushel (60 pounds)
From May 28 2020 to November 6 2020
source: Macro trends
China is the biggest importer of Soybeans and since the number of Chinese pigs is increasing in China, more soybeans are purchased in order to feed them. China is concerned about the COVID-19; thus, they have decided to increase its stock of soybean in order to not experience a shortage. The price increases since the demand has increased rapidly and the supply is decreasing. China imports principally soybeans from Brazil but when the supply is running low in this region, China buys them from the US.
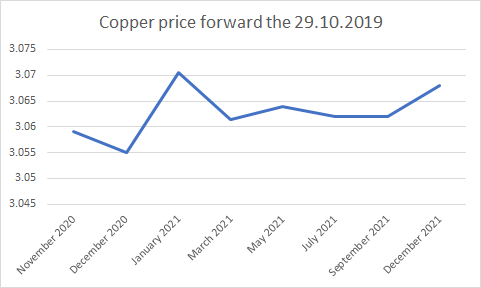
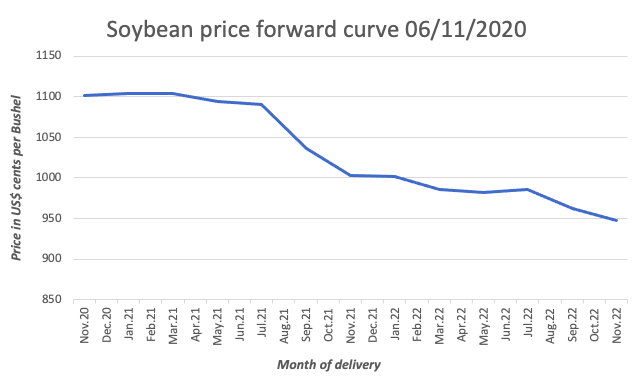
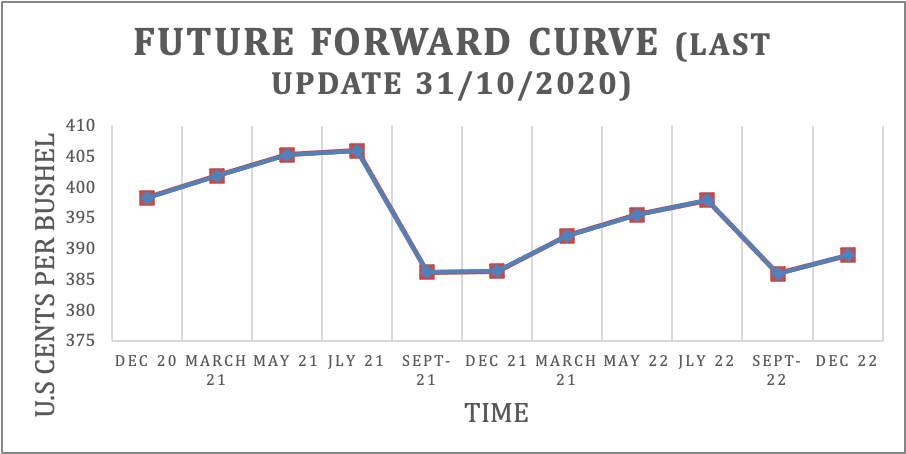
FORWARD CURVE
source: CME Group
As we can see, the forward curve is generally inverted. This trend can be explained by the weather concerns in South America. Irregular rainfalls caused by the La-Nina phenomenon could cause a shortage due to a decrease in productivity, which would explain why buyers are willing to pay a premium for delivery now. Furthermore, the demand for soybean is high due to Chinese mass pig farming. It is forecasted to go up to 2,7 million of bushels for the marketing year 20-21, while it was 2,4 million of bushels for marketing year 19-20.
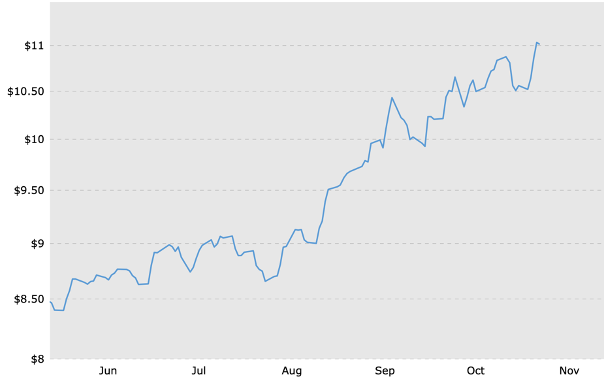
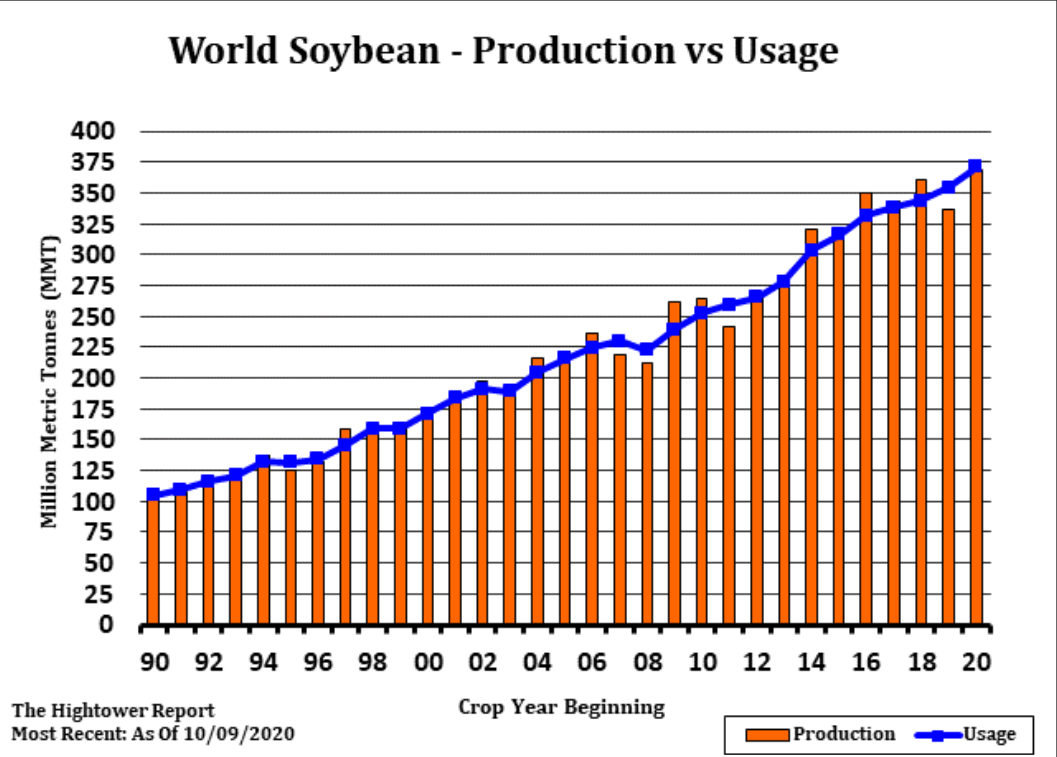
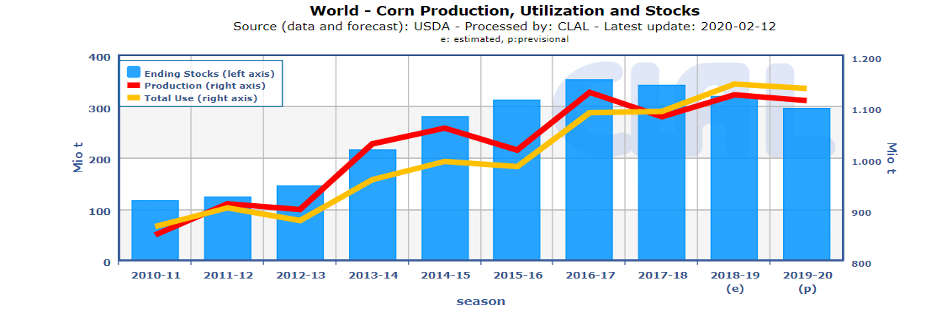
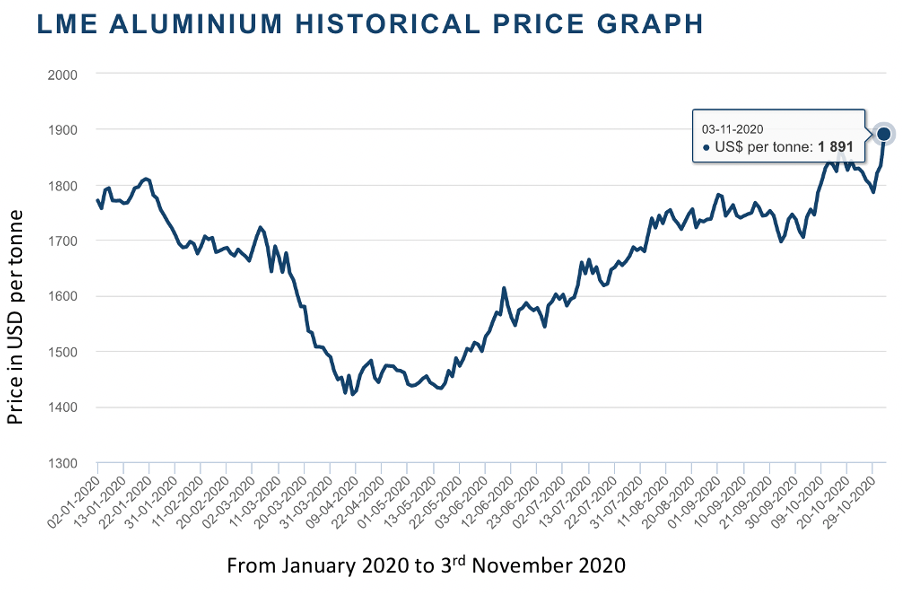
SUPPLY & DEMAND CHART
source: CME Group
As we can see the supply and demand are in constant increase since the 90s. As populations, income levels, and urbanisation expand worldwide, the demand for soybeans is boosted. Another major soybean trade driver is the different governments policies. The 3 main drivers of soybean’s supply are weather, protein demand and Chinese demand.
What is interesting is the 2018-2019 decrease. It coincides with the start of the US-China Trade War which led to a decrease in production. Nowadays the situation got better and China started to import from the US again.
On the demand side, China is the biggest importer. The recovery of China’s pork industry from the African swine fever has stimulated imports in 2020. Mainly because soybean is used as a source of feedstock in animal production.
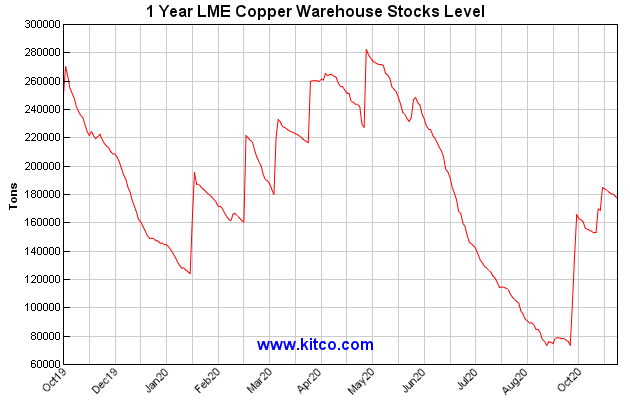
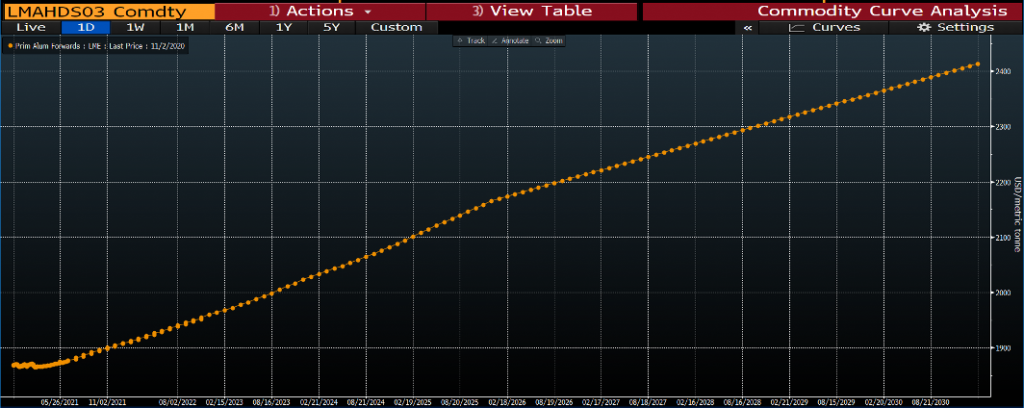
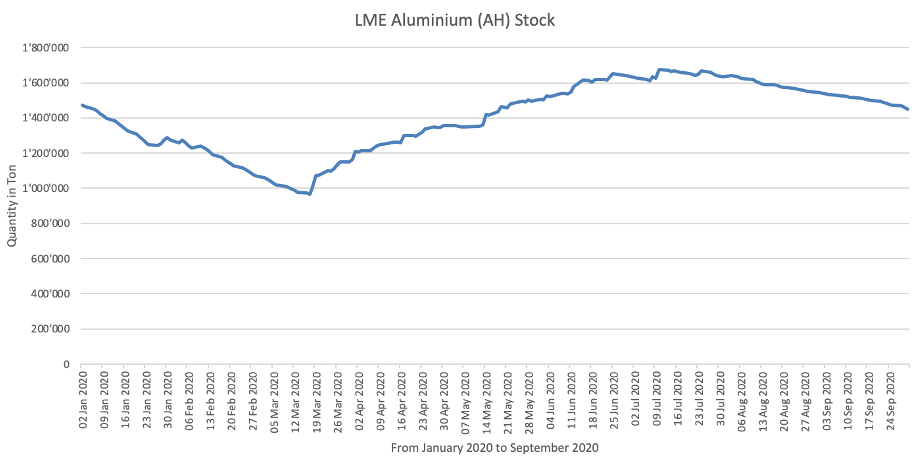
INVENTORY LEVEL (STOCK) CHART
source: CME Group
Brazil and the U.S. are the main soybean exporters and there have been supply issues in both countries. Due to COVID-19 Brazilian supplies have been limited.
Due to drier conditions in Brazil and Argentina, the future supplies might be lower. Dry conditions have negatively affected U.S. yields as well.

RECOMMENDATIONS
The Chinese economy is back to normal and there is a forecasted increase in demand. Therefore, importers are ready to pay a premium for delivery now as the supply is uncertain given the weather conditions coupled with COVID-19. Moreover, China imports first from Brazil and then from the US, since the harvest season happens at the beginning of the year in Brazil and at the end, in the US. From an importer’s point of view, we would recommend it to be long over the next few months as the supply will remain low.
REFERENCES
- A Supply Drop and Demand Pickup Pushed Soybeans to a Three-Year High, [no date]. [online]. [Viewed 10 November 2020]. Available from: https://www.spglobal.com/en/research-insights/articles/a-supply-drop-and-demand-pickup-pushed-soybeans-to-a-three-year-high
- Blog: World Soybean Production Projected to Rebound, 2020. IHS Markit [online]. [Viewed 10 November 2020]. Available from: https://ihsmarkit.com/research-analysis/blog-world-soybean-production-projected-rebound.html
- SAEFONG, Myra P., [no date]. Why soybeans may be headed for their highest price in 6 years. MarketWatch[online]. [Viewed 10 November 2020]. Available from: https://www.marketwatch.com/story/why-soybeans-may-be-headed-for-their-highest-price-in-6-years-11600450312
- Soybean Reports – CME Group, [no date]. [online]. [Viewed 10 November 2020]. Available from: https://www.cmegroup.com/content/cmegroup/en/trading/agricultural/soybean-reports.htm
- USDA ERS – Major Factors Affecting Global Soybean and Products Trade Projections, [no date]. [online]. [Viewed 10 November 2020]. Available from: https://www.ers.usda.gov/amber-waves/2016/may/major-factors-affecting-global-soybean-and-products-trade-projections/
- China’s Oct soybean imports jump 41% on year on swine fever recovery | S&P Global Platts, 2020. [online]. [Viewed 10 November 2020]. Available from: https://www.spglobal.com/platts/en/market-insights/latest-news/agriculture/110720-chinas-oct-soybean-imports-jump-41-on-year-on-swine-fever-recovery
- Chinese 2019-20 soybean imports to total 88 mil mt, up 6% on year: USDA | S&P Global Platts, 2020. [online]. [Viewed 10 November 2020]. Available from: https://www.spglobal.com/platts/en/market-insights/latest-news/agriculture/021220-chinese-2019-20-soybean-imports-to-total-88-mil-mt-up-6-on-year-usda
- Soybean Futures Quotes – CME Group, [no date]. [online]. [Viewed 10 November 2020]. Available from: https://www.cmegroup.com/content/cmegroup/en/trading/agricultural/grain-and-oilseed/soybean_quotes_globex.html
- Soybean Futures Quotes – CME Group, [no date]. [online]. [Viewed 10 November 2020]. Available from: https://www.cmegroup.com/trading/agricultural/grain-and-oilseed/soybean_quotes_globex.html
- Soybean Prices – 45 Year Historical Chart, [no date]. [online]. [Viewed 10 November 2020]. Available from: https://www.macrotrends.net/2531/soybean-prices-historical-chart-data
- TAN, Huileng, 2020. Soybean futures have been surging on Chinese demand, trade group CEO says buying could continue. CNBC [online]. 10 September 2020. [Viewed 10 November 2020]. Available from: https://www.cnbc.com/2020/09/10/soybeans-have-been-surging-on-chinese-demand-and-purchases-could-continue.html
Group 3 – K
Maxime DOLLA, Mahona PENNA, Romane POUCHON

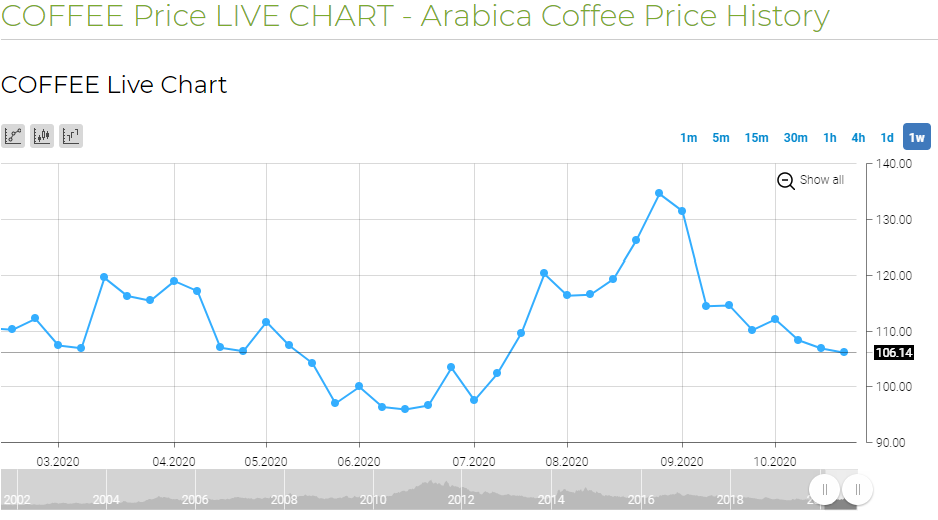
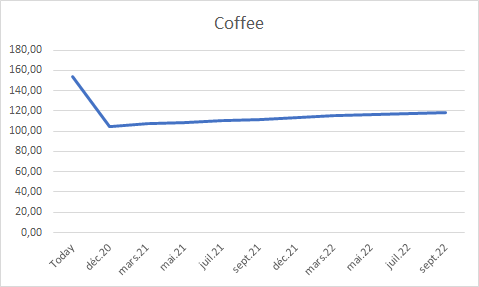 future coffee in USD/100 pounds
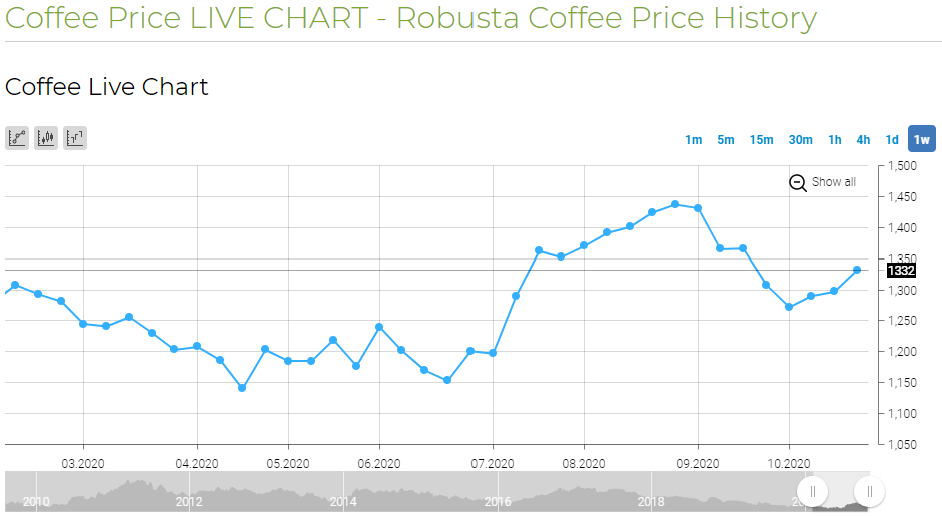
 future cocoa in USD/metric ton