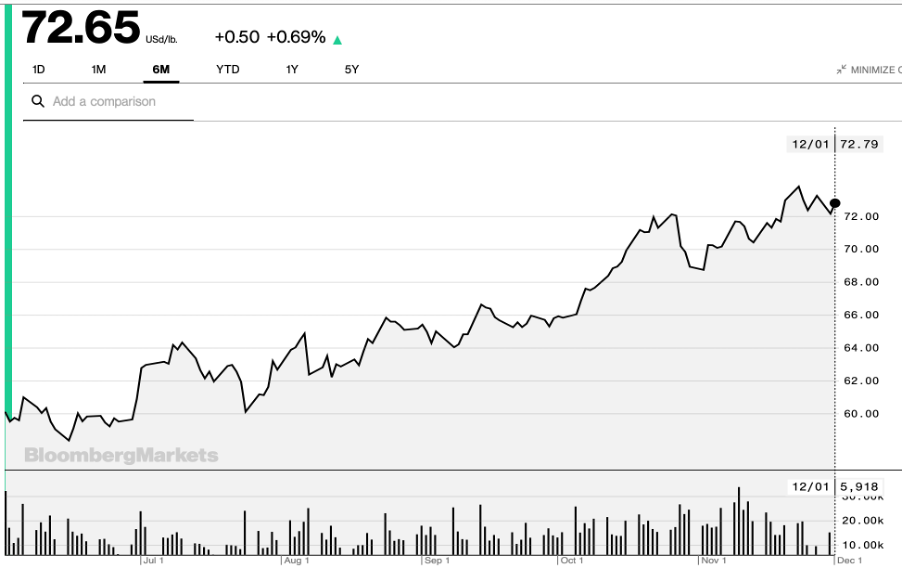
As usual we will do a small recap on the price of sugar. The first bulletin showed a price of 0.1379$ and the second one 0.1483$. Sugar today’s price reached 0.1451$. As we can see, price level tends to recover the prices before the pandemic.
Sugar price in USD/pound
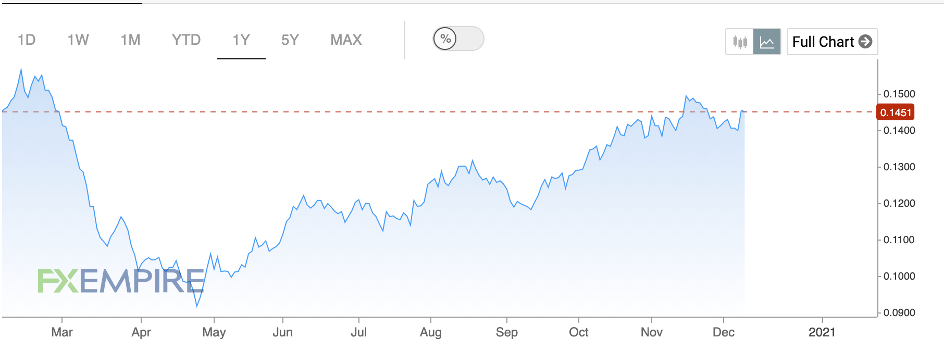
Source: https://www.fxempire.com/commodities/sugar
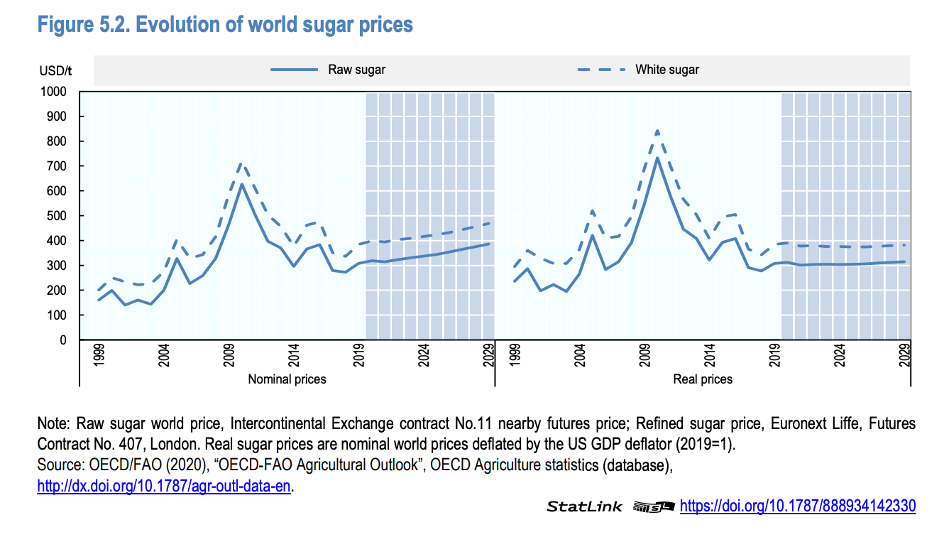
World sugar prices:
As we can see in the graph below, sugar prices decreased in the recent years. In term of nominal price we can see that the prices are forecasting to increase. If we assume that weather will be normal, we can expect that India and Thailand crop will come back to their level as previous years.
In term of real sugar prices, we can see that it would remain at the level of 2019. This could be explained by the competitiveness of ethanol which is made from sugar.
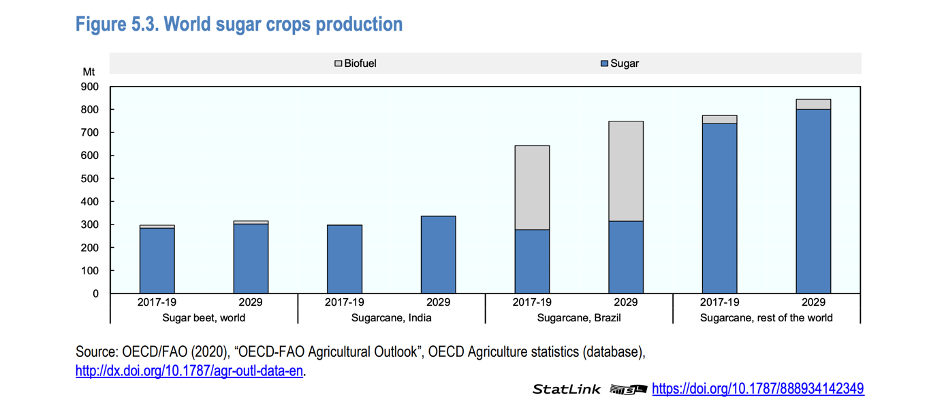
World sugar crops production in the long term :
Here we can see a comparative and forecast between sugarcane and sugar beet in India, Brazil and the rest of the world.
That is interesting to see that biofuel such as ethanol represents more than the half of the total production in Brazil, whereas in India there is no ethanol production. Moreover, we can see that the production forecast for 2029 tends to increase. Indeed, Brazil will remain the main producer in ethanol. As we have seen in the last bulletin, India is impacted by public sector, that is why we can explain the small increase in the production on contrary to Brazil.
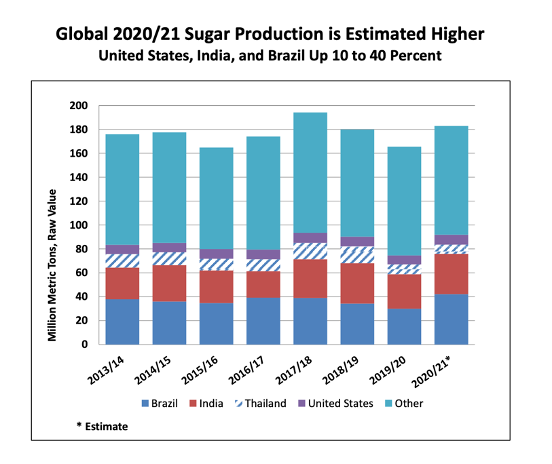
In addition to the graph above, this graph below shows the increase in the production of sugar. Especially in developing countries such as India and Thailand, because of the increase in demand.
Just to say something about the export, something changes in the currency. The real the 7th of December rose +0.99% against the dollar, which discourages export selling by Brazil’s sugar producers.
We can also look back at what is currently happening in India in terms of exports (in relation to the uncertainties related to subsidies). Thus, since Bulletin #2, Indian sugar mills have held back exports as they await news on government subsidies (still no news). The World Trade Organization (WTO) is expected to rule on the legality of India’s subsidies to its sugar exporters by the end of 2020.
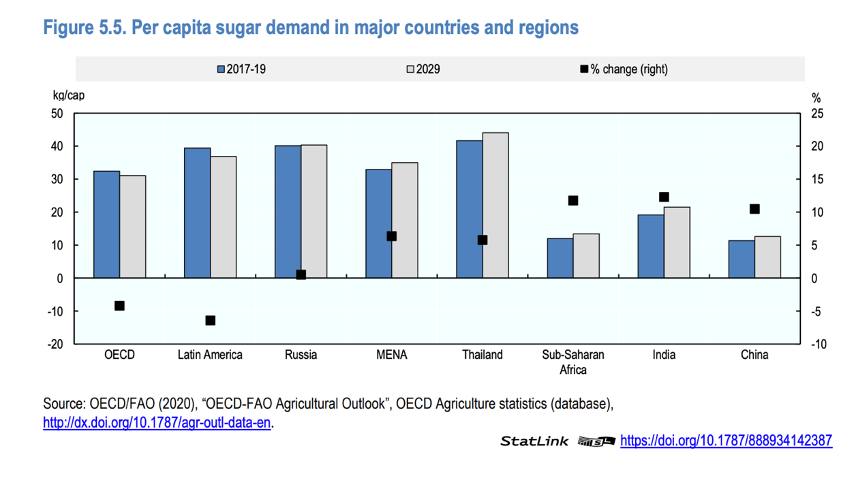
Sugar demand in the long term :
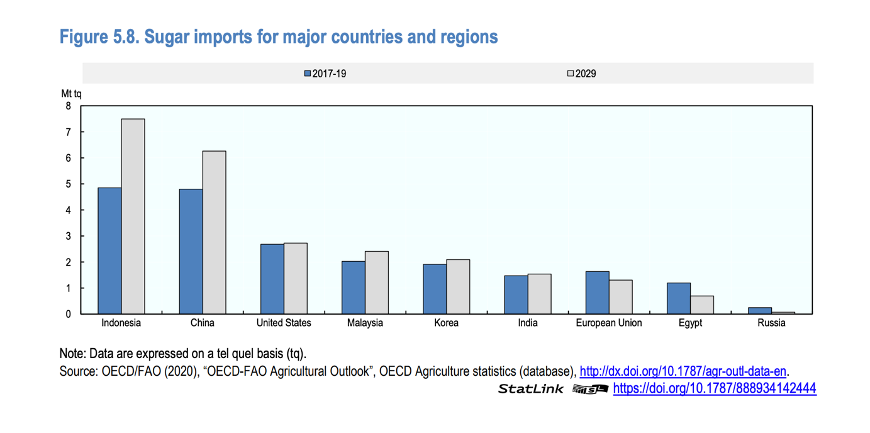
The demand in sugar is expecting to grow and to come mainly from the developing countries. As we noticed, Asia and Africa will be the main contributor to the increase in demand of sugar (figure 5.5). Indeed, in figure 5.8 we can see that in Indonesia and China the sugar imports are expecting to grow substantially. In contrary, developed countries will decrease their demand, due to health concerns. But also due to taxes on caloric sugary products like in Mexico, that is why we can explain the drastic decrease in demand. The overall extent of the global recovery in sugar consumption will depend on how the COVID-19 pandemic develops in the coming months, and particularly on whether or not further lockdown measures would be imposed.
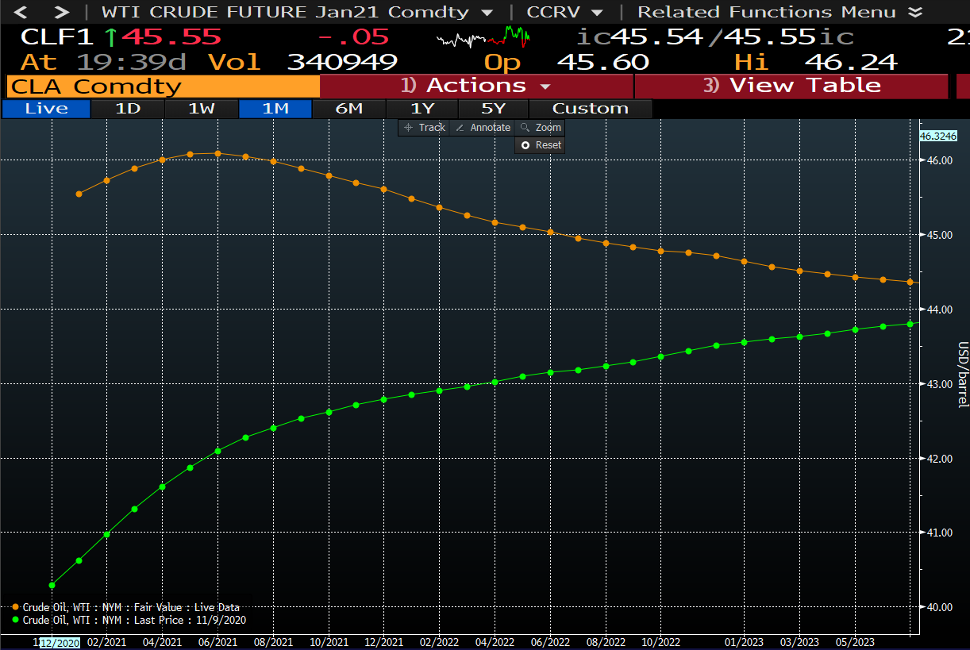
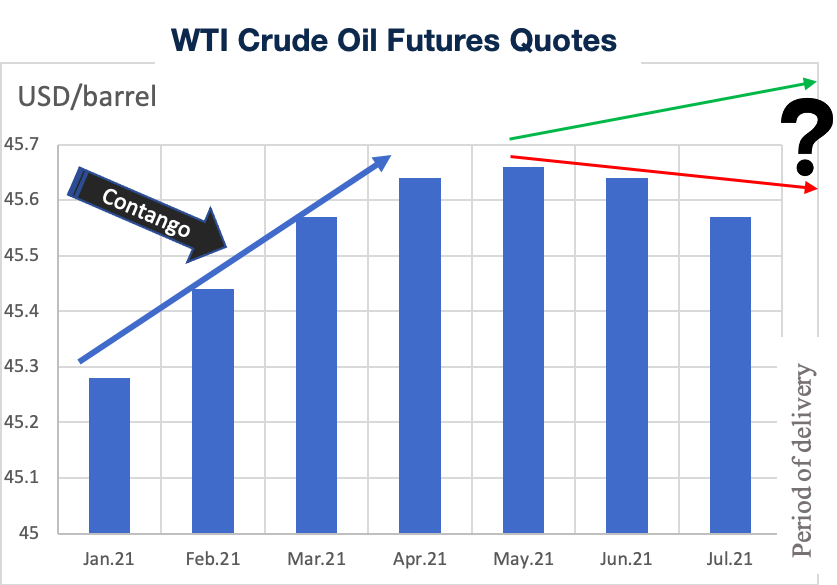
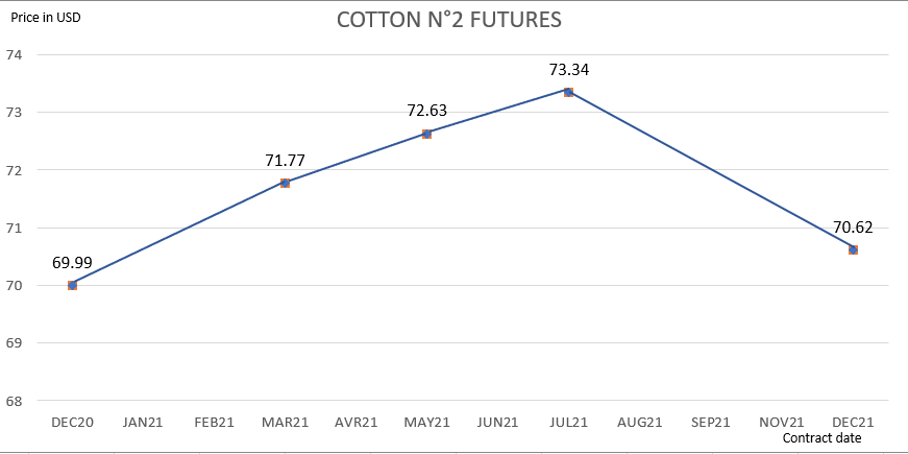
As we can see in the graph below we have a backwardation until October 2021 then a contango until March 2021 and finally a backwardation until October 2022.
Sugar price in USD/pound
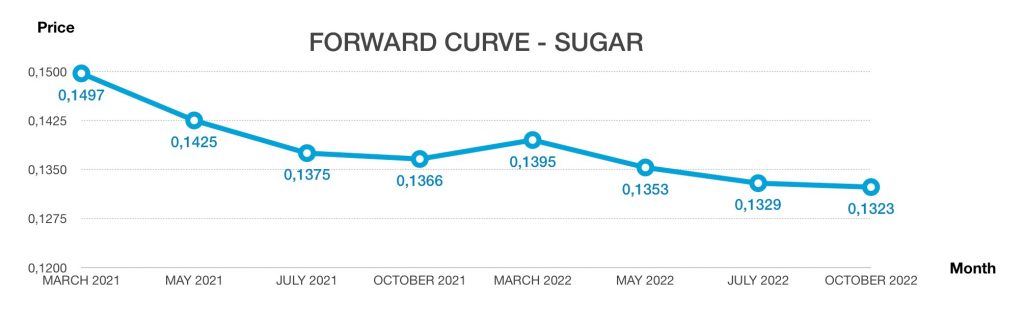
Recommendation :
As we can expect a backwardation we recommend to go long. But still we are in an uncertain time due to COVID-19 but also weather it means that prices need to be monitored, in order to be protected against eventual inverse price movements. Furthermore, the situation in India due to the public sector tends to remain uncertain.
References :
Sugar Price | FX Empire, [no date]. [online]. [Viewed 7 December 2020]. Available from: https://www.fxempire.com/commodities/sugar
No. 11 Sugar Futures Quotes – CME Group, [no date]. [online]. [Viewed 9 December 2020]. Available from: https://www.cmegroup.com/trading/agricultural/softs/sugar-no11.html
sugar_assessment_food_outlook_may_2019.pdf, [no date]. [online]. [Viewed 8 December 2020]. Available from: http://www.fao.org/fileadmin/templates/est/COMM_MARKETS_MONITORING/Sugar/Documents/sugar_assessment_food_outlook_may_2019.pdf
OECD iLibrary | Sugar, [no date]. [online]. [Viewed 9 December 2020]. Available from: https://www.oecd-ilibrary.org/agriculture-and-food/oecd-fao-agricultural-outlook-2020-2029_3736a600-en;jsessionid=80bZjxAzpg34HglxJQ0fpdbM.ip-10-240-5-119