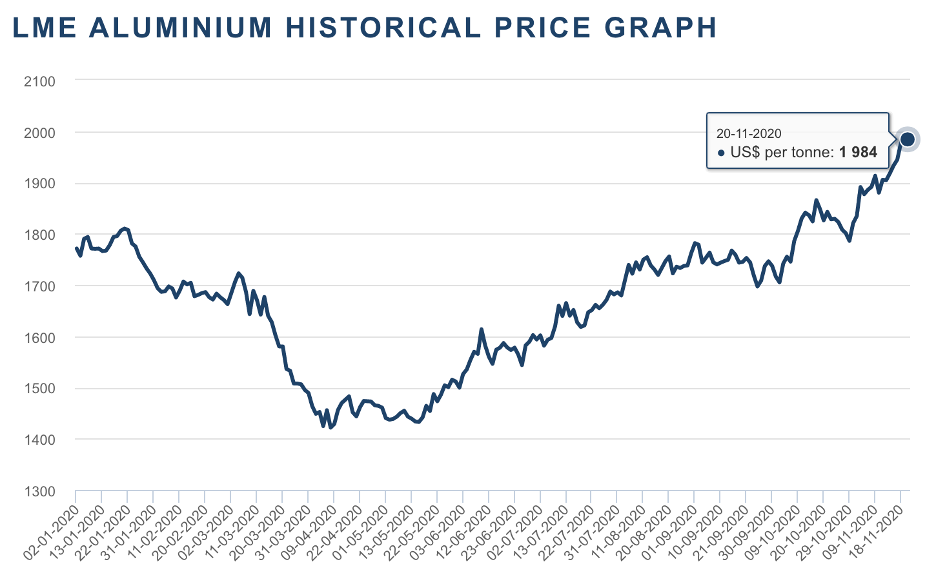
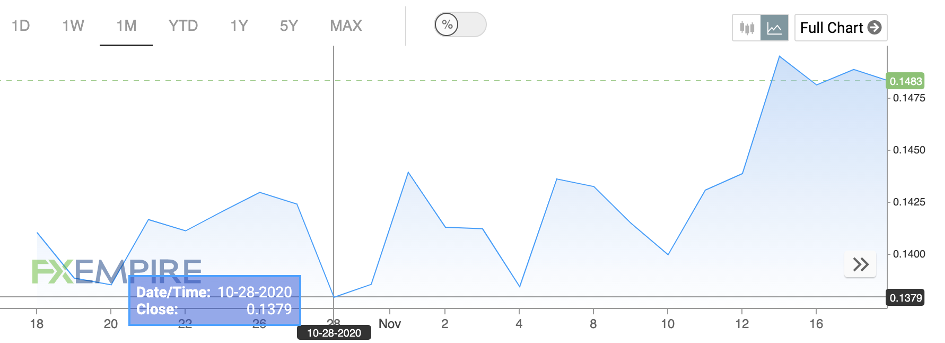
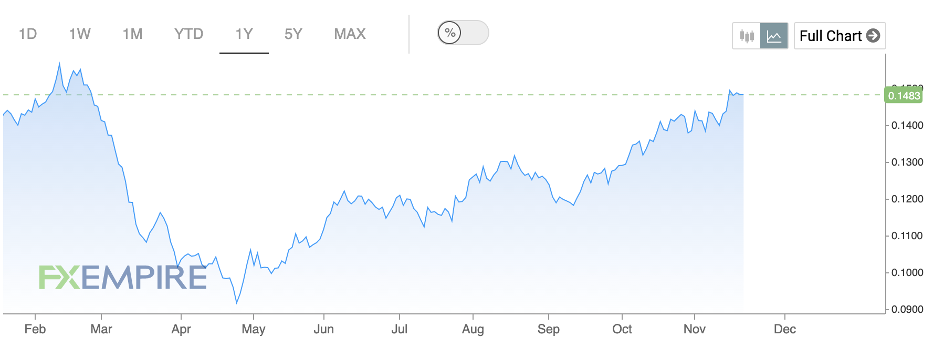
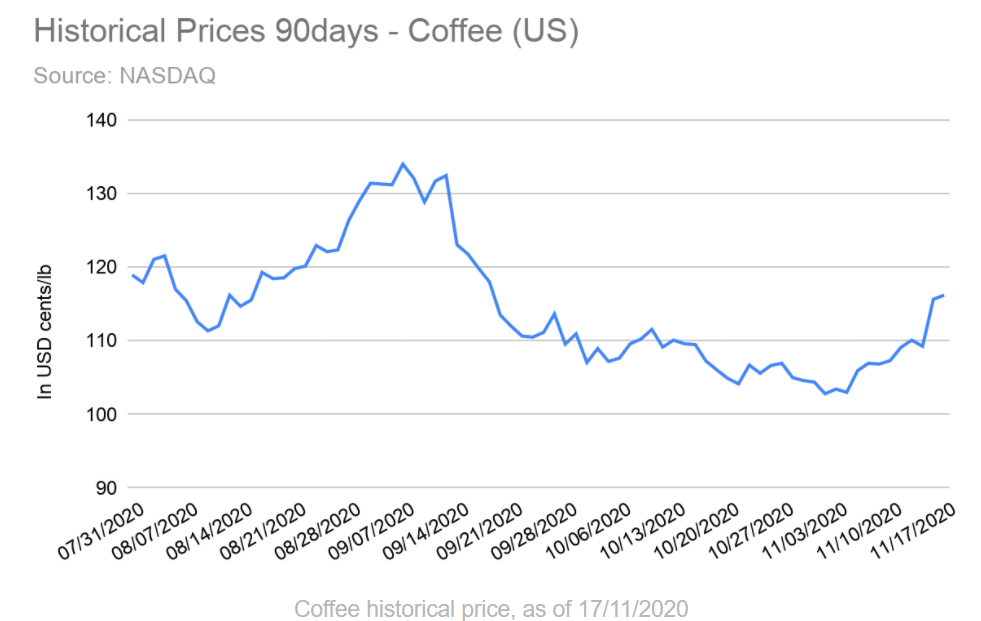
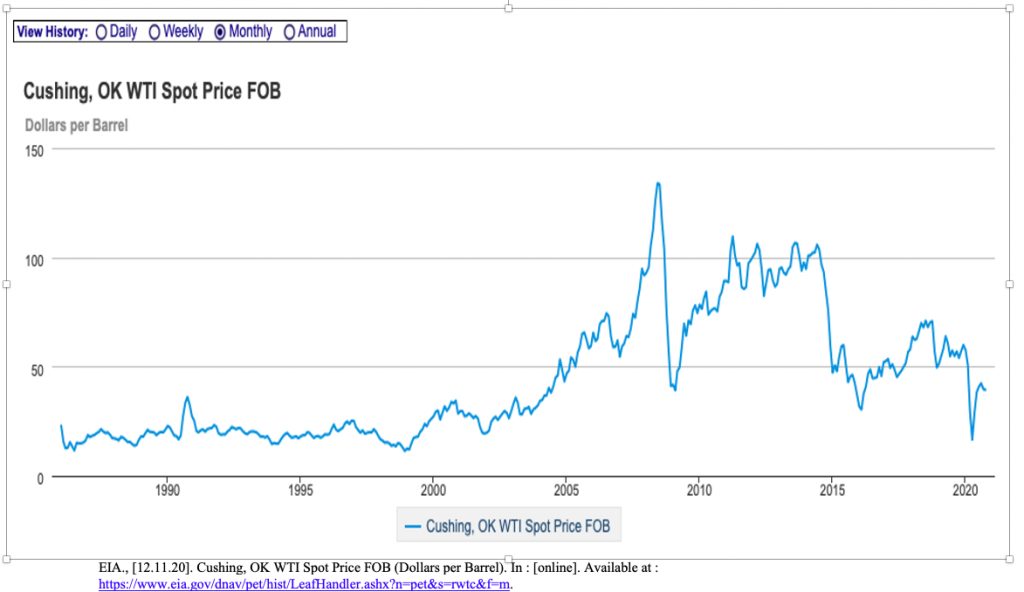
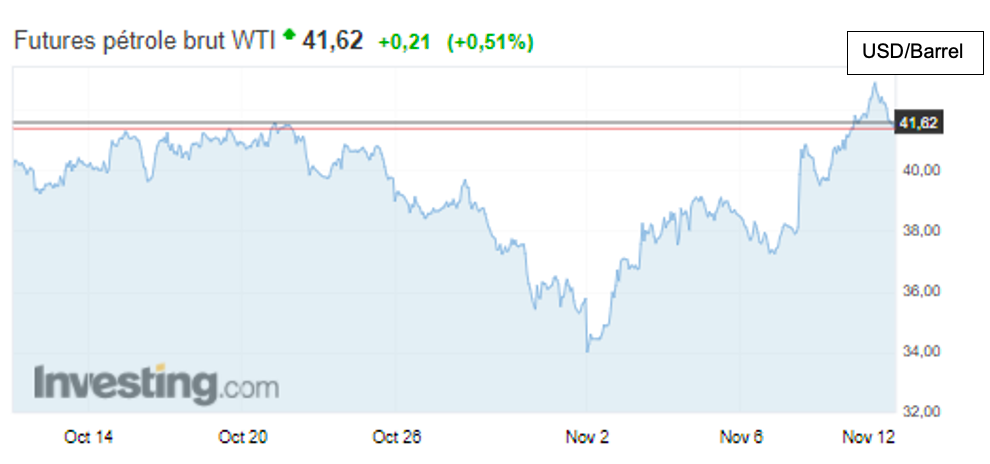
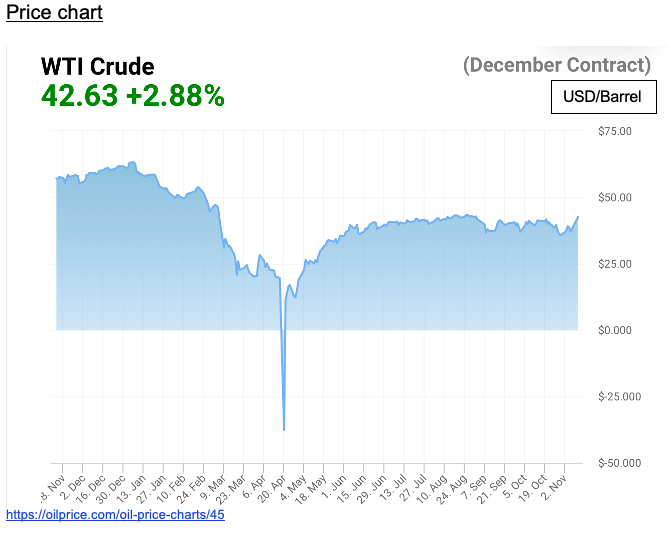
Price movement
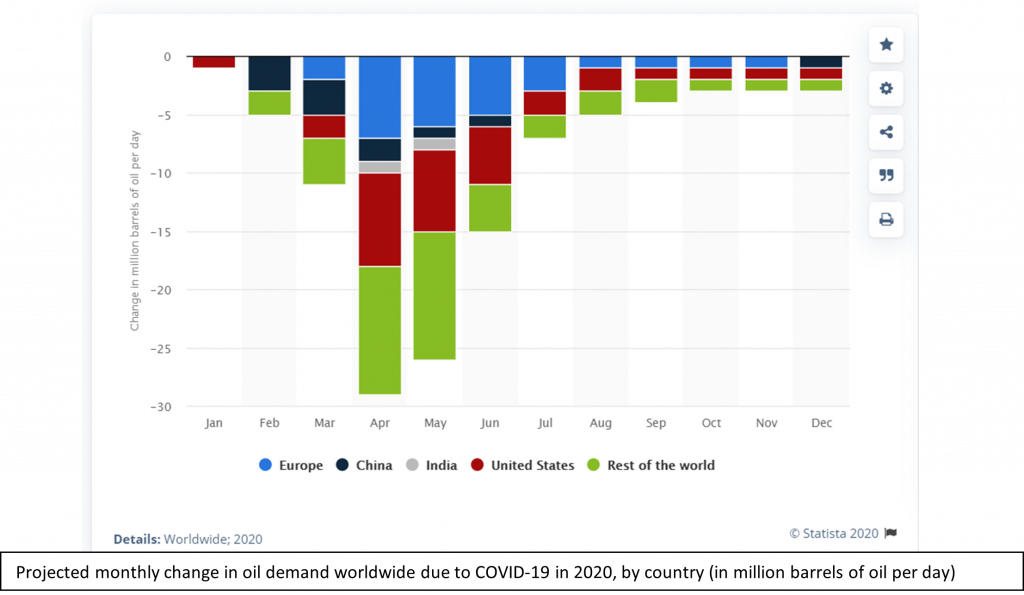
Despite uncertainties about the second wave of covid-19, the fall in prices was limited due to disruptions in oil supply in several regions. Recent information about a possible vaccine and the demand for oil in China and India have supported the rising trend. Hedge funds and fund managers have slightly modified their positions in response to covid-19 uncertainties and global demand predictions, but this has not stopped the upward trend in prices. Nevertheless, the decrease in US oil stocks in coupled with the price war between Russia and Saudi Arabia is impacting the market.
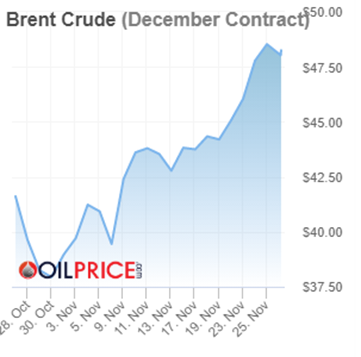
(date in 2020 / $ per barrel)
Differentials
In Europe, the value of Urals (medium sour crude) is at a premium against Brent (light sweet) due to the strong demand from Mediterranean and Asian refiners. In addition, the value of Urals is supported by a lower loading in November than in October due to increased demand from Russian refineries. Furthermore, the difference between a high supply and a low demand for Brent crude coupled with an increase in American and Libyan exports add further pressure on the latter.
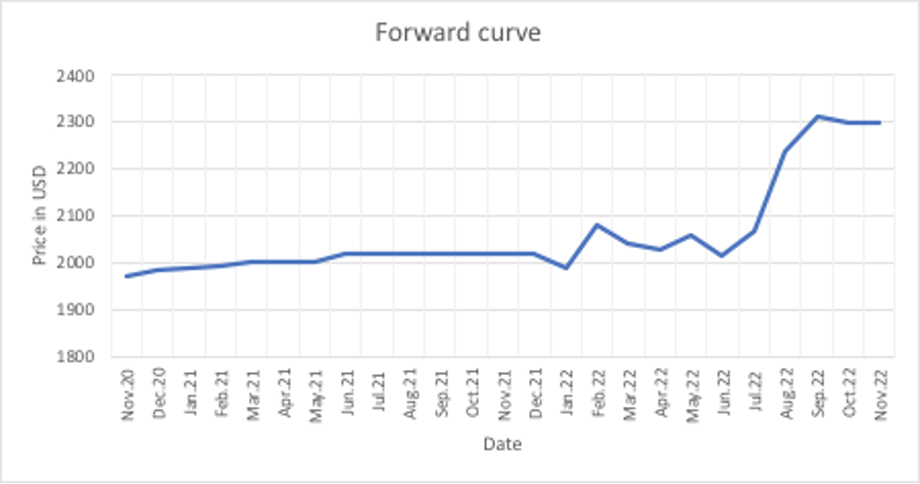
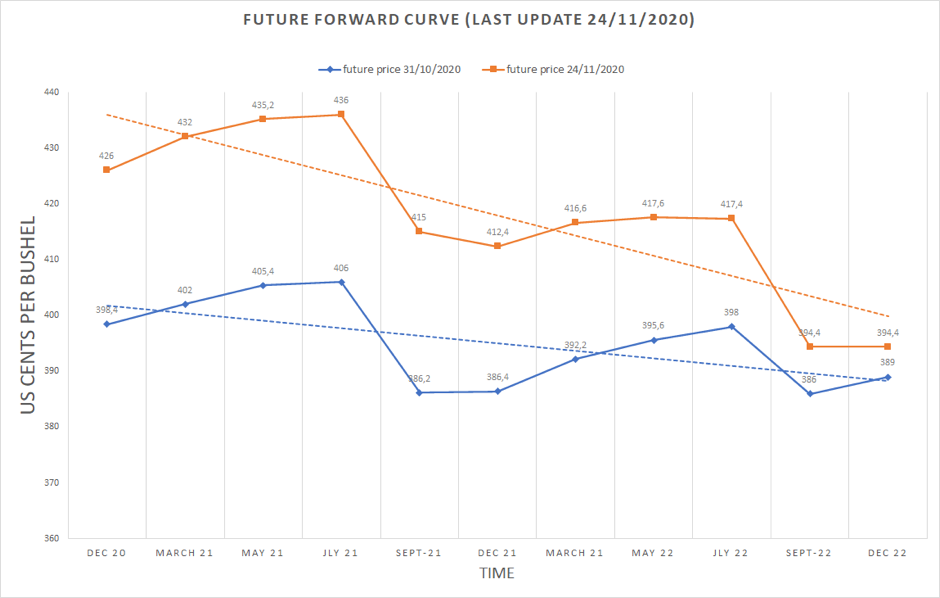
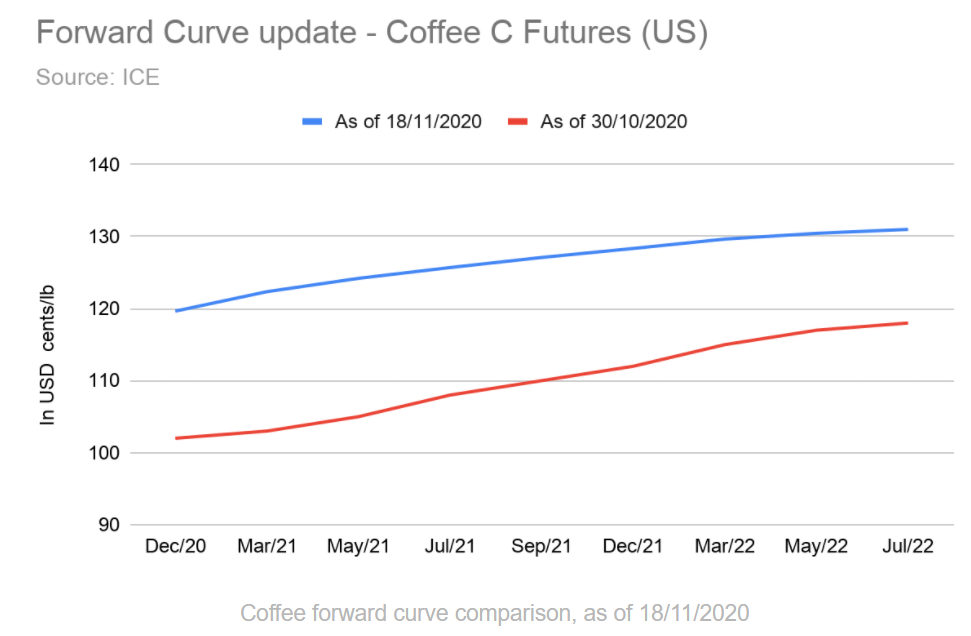
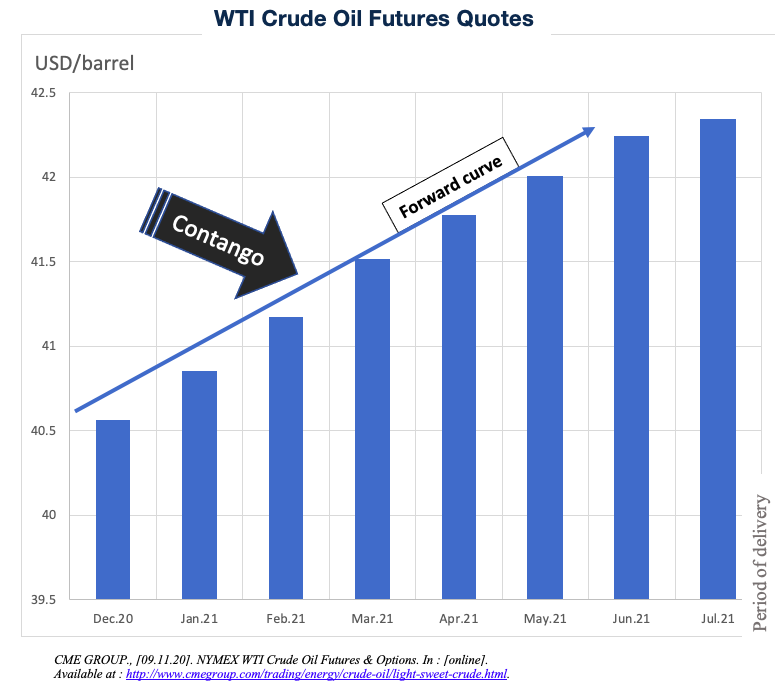
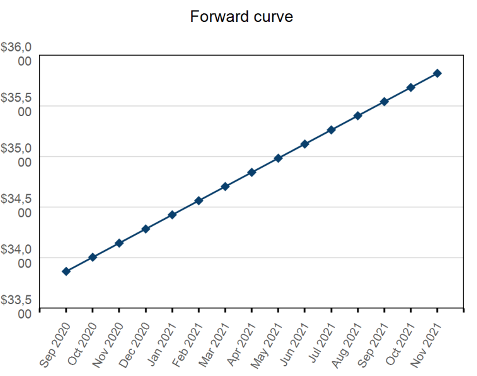
Forward Curve
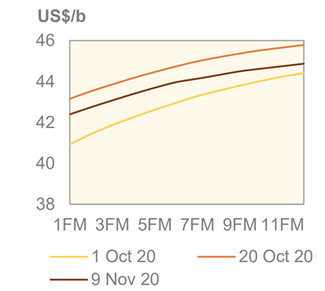
Sources: ICE and OPEC https://www.opec.org/opec_web/en/publications/338.html
(forward month/ $ per barrel)
The forward curve shows a sustained contango in October as oil supply and demand prospects deteriorated. The supply of cargoes remained modest, while floating storage in the North Sea was significant. The COVID-19 disruptions have affected trade. High stocks and the development of floating storage also had a negative impact.
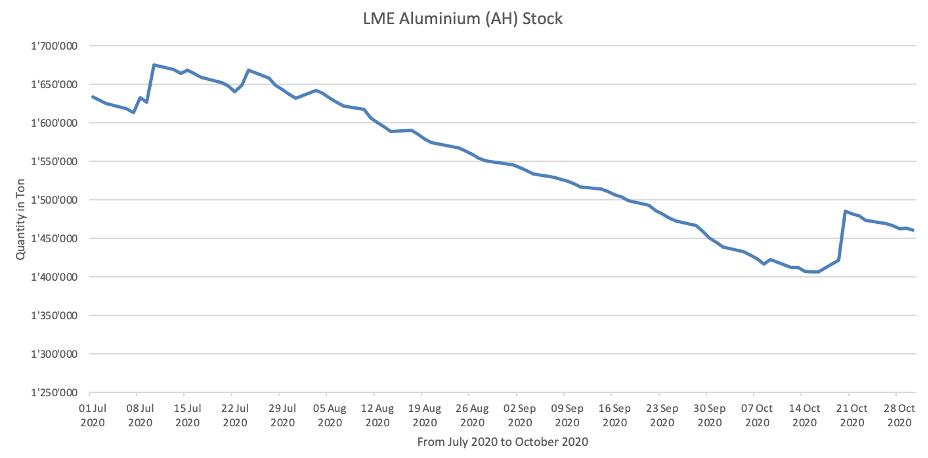
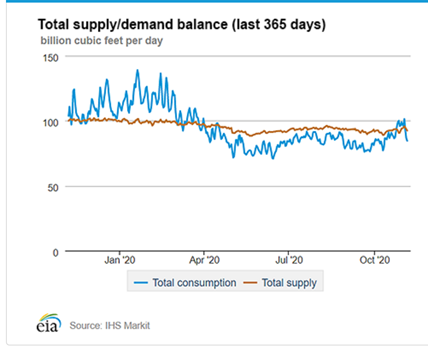
Supply and Demand drivers, and stock levels
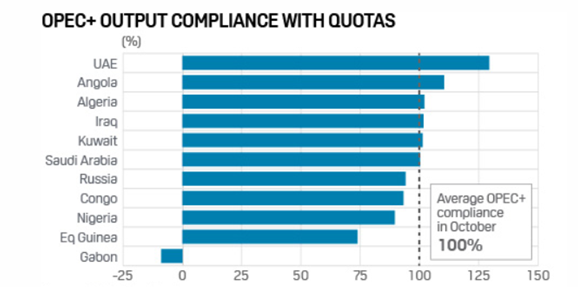
There are a few key factors that influenced the supply and demand, the first to consider is the ongoing deal of the OPEC+ members, concerning the planned reductions in oil productions. The members originally planned on cutting more of their production by 2 mbp .Though, the recent discussions, on November 17th were not decisive and they planned on not cutting the supply before seeing how the situation is going to evolve and postponing a decision to January 2021. As a matter of fact, Russian oil producer recently met with the country’s Energy Minister, and let hear that they were not ready to accept deeper cuts, and that all they could do was keeping on going with the actual reduction, but not more than this.
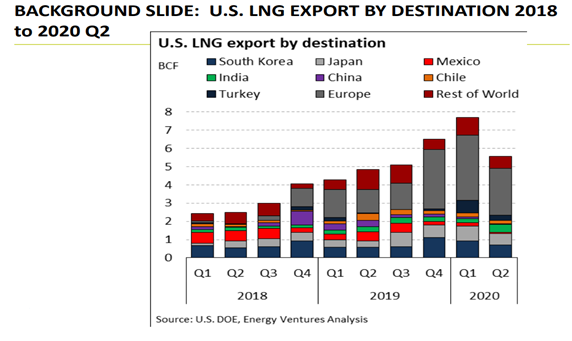
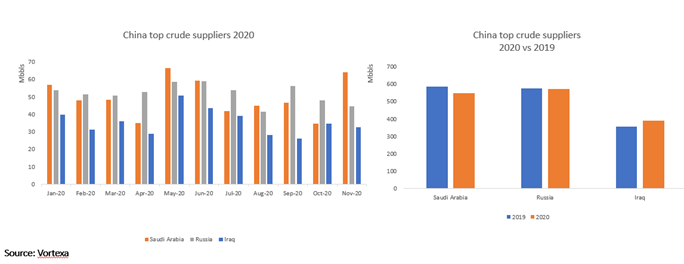
Another very important point that influences the supply and demand of Russian crude oil is the ongoing “war” with Saudi Arabia, where both want to become the first supplier of China, as they are taking advantage of the very low oil price. Both Saudi Arabia and Russia are trying to cope with the high demand and win the Chinese market, boosting their export to China, whose demand is still going strong despite the Covid-19 pandemic and the global demand being low. For the past year, Russia was ahead in term of export, but the latest month their first place was taken by Saudi Arabia
Asia is a very important market for Russian crude, and it doesn’t only involves China, Asian country are entering a bidding war on the price to ensure that they will secure their supplies, an example being cargoes from Russia being bought at very high prices, such as Chinese and Japanese buying Russian ESPO (Eastern Siberia–Pacific Ocean oil pipeline) at a five-month high premium price. What could further influence the demand and supply is the fact that Asian refiner are lacking oil supply contract from OPEC members, and they will most probably turn to Russia, who is fully able to respond as they didn’t cut production as much as planned.
As for the demand, it could improve depending on the evolution of the Covid-19 pandemic as hope for a vaccine could improve it, but still, this remains to be seen. As of now, analysts say that the oil demand is usually low in the first quarter of the year, and the fragile oil market may not be able to absorb the additional supplies, that means that the OPEC+ deal cuts are very important and that the parties involved should respect the cuts in quantity they planned on.
Finally, a last factor could also influence the demand. Northeast Asian countries, such as Japan and South Korea, are expecting very cold winters, and it could benefit Russia. In fact, some producer from far East Russia are already planning on making short haul delivery to those country and boost their kerosene output to cope with the incoming demand. And, the time necessary for a delivery from far East Russia to Northeast Asia being only around a week, compared to the 10-15 necessary from South East Asia, the concerned country will most likely take advantage of Russia’s oil supply.
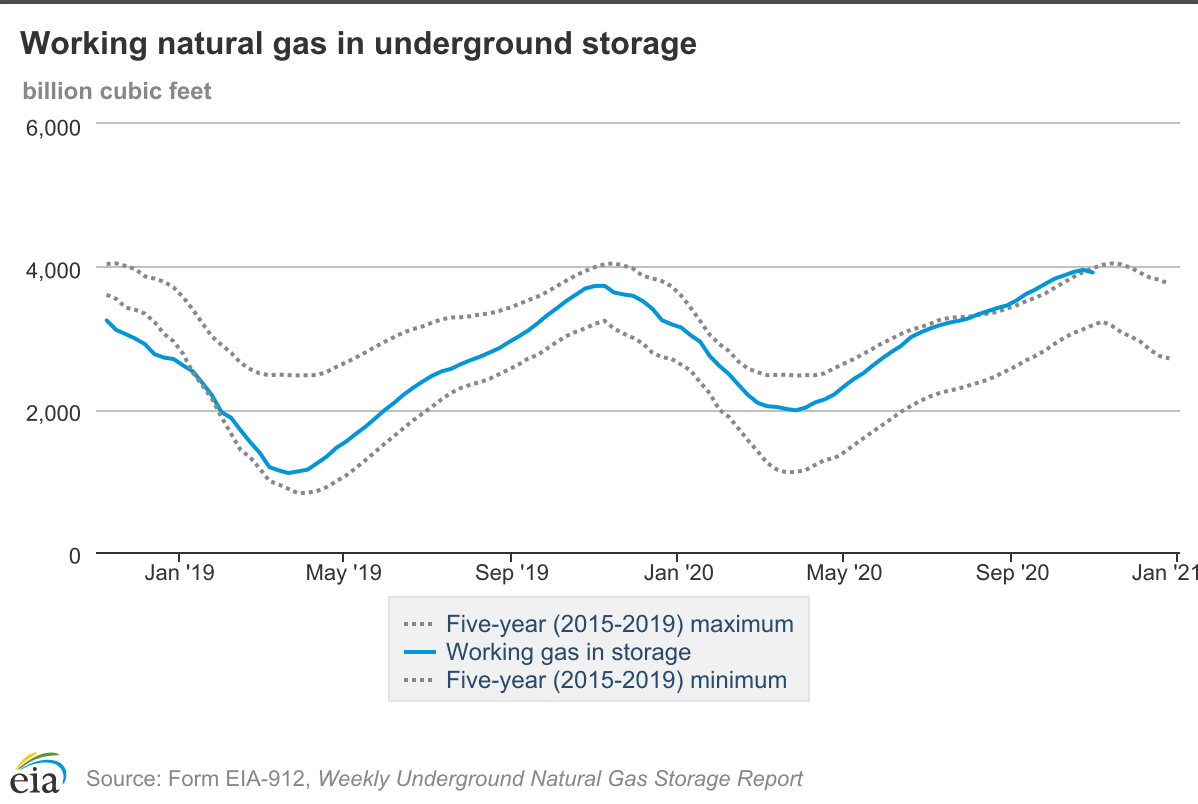
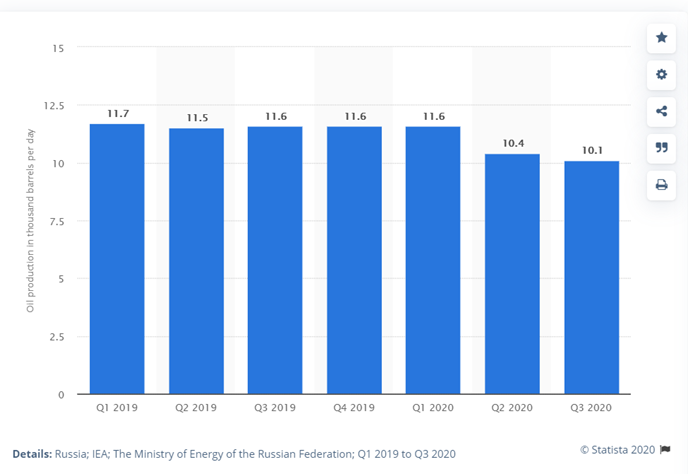
As for the stock levels, Russia’s energy sector being totally state controlled, and the country being the opposite of transparent, it is extremely hard to find up to date data. However, the inventory levels were of 13 billion metrics tons in the beginning of 2020, according to the US Energy Information Administration, while they were of 14,7 billion metrics in 2019.
Recommendations
The demand from Asia and the production cuts driven by members of OPEC+ have a positive impact on the market. Based on the information provided in this bulletin, we advise a long position and to be attentive to the information that will result from the next OPEC+ meeting.
Sources
“Opec committee reveals no 2021 oil cut guidance as ministers will wait to decide”. Consulté les 23 et 24 novembre
https://www.spglobal.com/platts/en/market-insights/latest-news/oil/111720-opec-committee-reveals-no-2021-oil-cut-guidance-as-ministers-will-wait-to-decide
“Oil from Russia to US snapped up on Asia’s growing appetite”. Consulté le 23 novembre.
https://www.bloomberg.com/news/articles/2020-11-17/oil-from-russia-to-u-s-snapped-up-on-asia-s-growing-appetite
“Oil climbs with Russia in talks on delaying OPEC output hike”. Consulté le 24 novembre
https://energynow.com/2020/11/oil-climbs-with-russia-in-talks-on-delaying-opec-output-hike/
“Russia: It’s Too Early To Talk About Tweaking OPEC+ Deal”. Consulté le 24 novembre
https://oilprice.com/Energy/Energy-General/Russia-Its-Too-Early-To-Talk-About-Tweaking-OPEC-Deal.html
“Commodity Tracker: 4 charts to watch this week”. Consulté le 24 novembre
https://www.spglobal.com/platts/en/market-insights/blogs/oil/ct-opec-meetings-russian-crude-palm-oil-france-nuclear
”Graphic: Saudi Arabia and Russia in tight race to become China’s top oil supplier in 2020”. Consulté le 24 novembre
https://in.reuters.com/article/china-oil-saudi-russia-graphic/graphic-saudi-arabia-and-russia-in-tight-race-to-become-chinas-top-oil-supplier-in-2020-idINKBN2800HE
“The Battle for Dominance In China’s Oil Market”. Consulté le 25 novembre
https://oilprice.com/Energy/Energy-General/The-Battle-For-Dominance-In-Chinas-Oil-Market.html
Monthly report. Consulté le 24 novembre
https://www.opec.org/opec_web/en/publications/338.htm
Chart. Consultés le 24 novembre
https://www.cmegroup.com/trading/energy/crude-oil/brent-crude-oil.html
https://oilprice.com/oil-price-charts/
Differential. Consulté le 25 novembre.
https://www.neste.com/investors/market-data/urals-brent-price-difference
“OPEC+ leaning towards oil cut extension, despite rally: sources”. Consulté le 25 novembre
https://www.reuters.com/article/us-oil-opec/opec-leaning-towards-oil-cut-extension-despite-rally-sources-idUSKBN285273
“Oil rally stalls on signs of more supply, demand doubts”. Consulté le 25 novembre
https://www.reuters.com/article/us-global-oil/oil-rally-boosted-by-surprise-fall-in-u-s-stocks-idUSKBN28603W