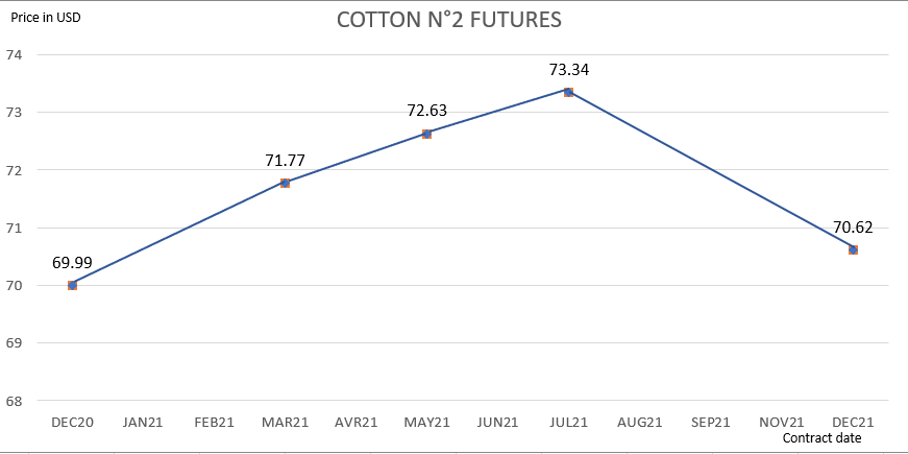
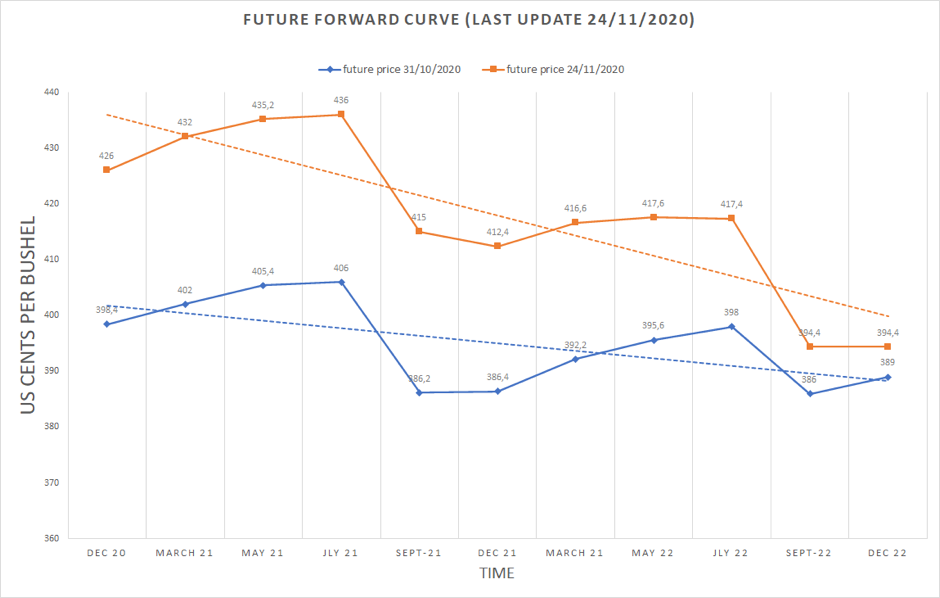
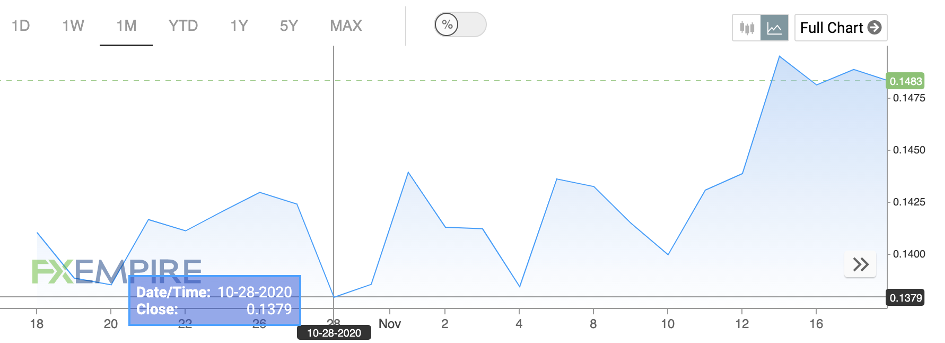
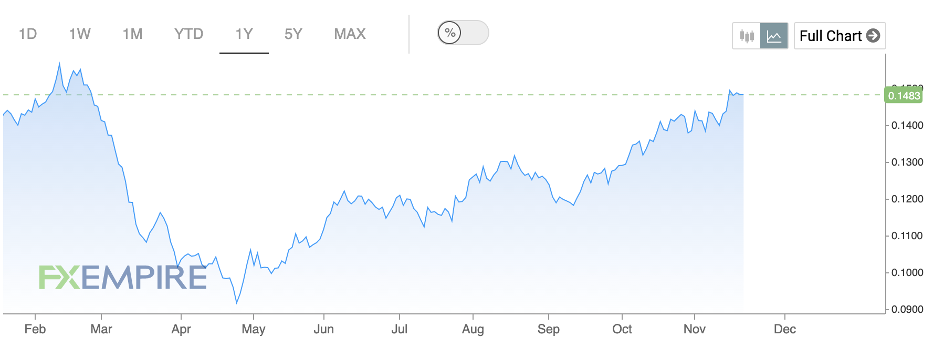
PRICE MOVEMENT RECAP

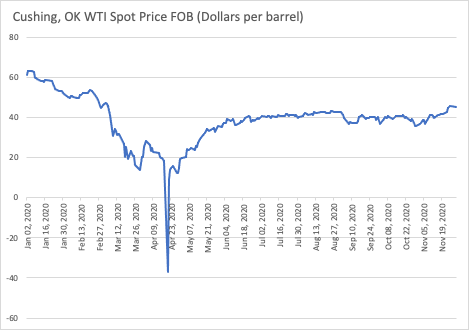
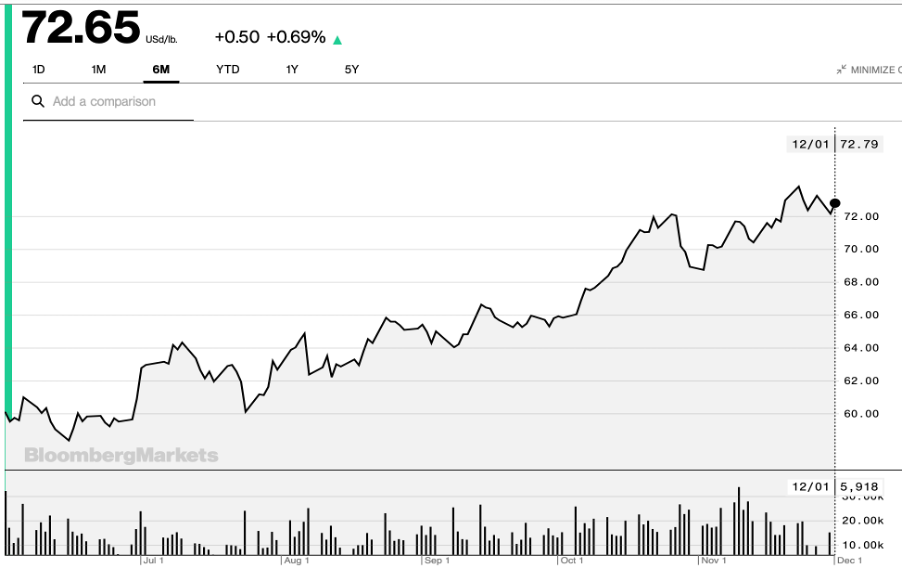
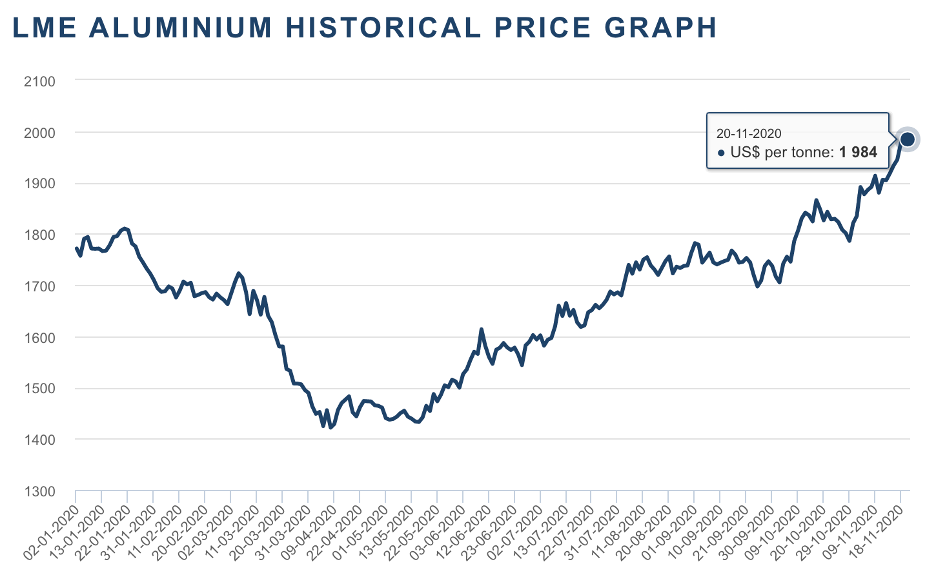
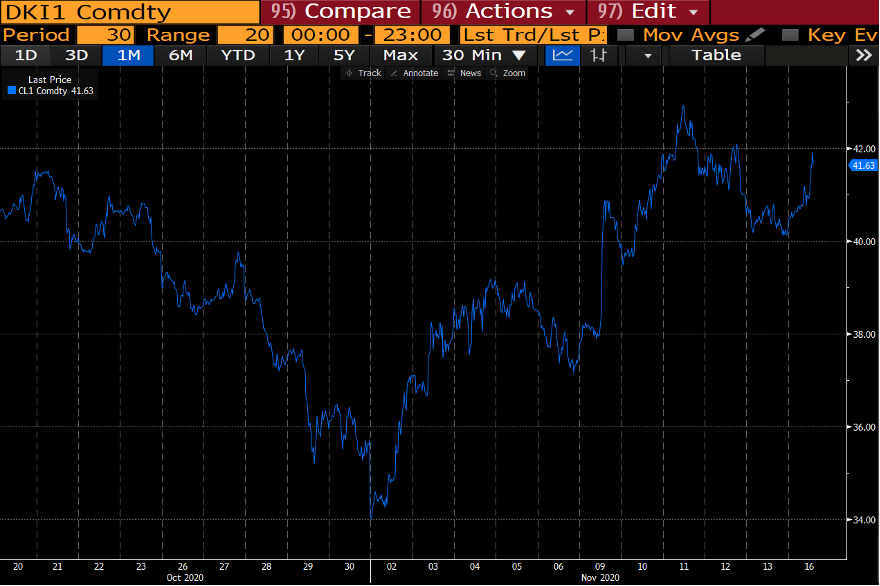
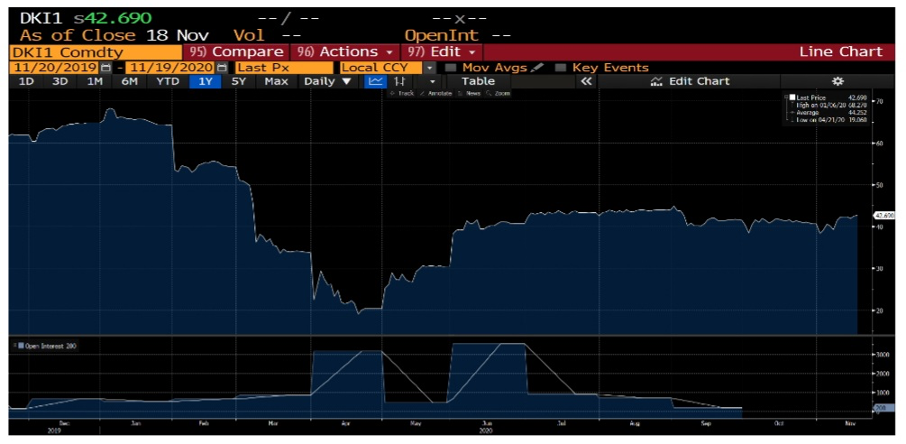
The graph shows that the price continues to increase as expected. The worldwide supply is currently low since latin american producers are not in their harvest season and that the US is done with their harvest season. Moreover, the production of soybeans in Brazil and Argentina is uncertain because of the La Niña phenomenon. There have been extreme low rainfalls, altering the growth of soybeans. Now, the lands are extremely dry, which will postpone the planting season and thus alter the supply. Although Argentina seems to experience better weather, their contribution to the worldwide production is not significant enough to make up for other countries’ decreasing production. The consequences of this is that the supply is low but the demand is high, since China is continuing to buy a lot from the US. Thus, the price will continue to increase.
What is interesting is that some chinese importers are willing to cancel the purchase of some of the agreed US cargoes for December and January, since they have not entered into a futures contract before, as they were not expecting such a rise in the price. Importing soybeans at the current price means that they would lose money. The potential consequences on the price remains unknown since the size of the cancelled cargoes has not been disclosed.
Additionally, Biden’s administration is expected to maintain the US’ trade tariffs policy on China, but will be more predictable to China compared to Trump’s administration, as said by Lee Heng Guie, executive director of the Associated Chinese Chambers of Commerce
Worth mentioning that the Biden administration is focused on multilateral approach.
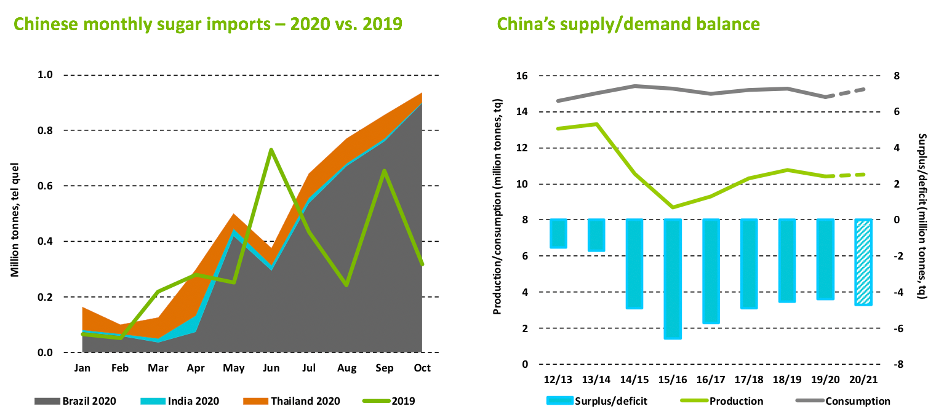
China has committed to purchase US$36.3 billion worth of US agricultural products, including soybeans, in 2020 and US$43.3 billion in 2021 as agreed in the Phase 1 of their agreement on trade.
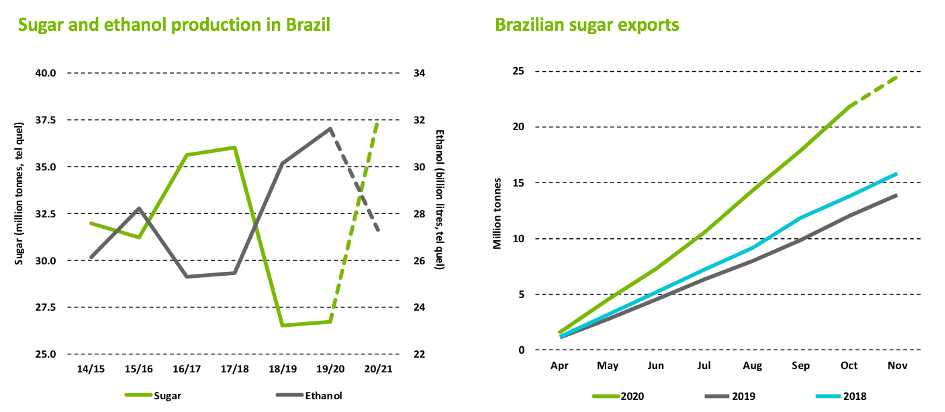
However, China has been buying more soybeans from Brazil than usual, resulting in Brazil selling more than the US to China.
Therefore, as Brazil had to sell more to China, both countries needed to buy soybeans from the US to meet their requirements. This results in a tight supply and demand, increasing soybean prices.
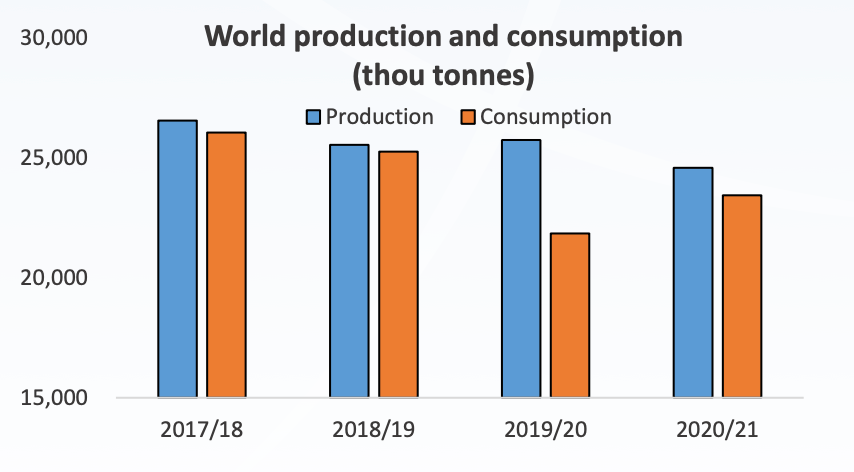
INVENTORY
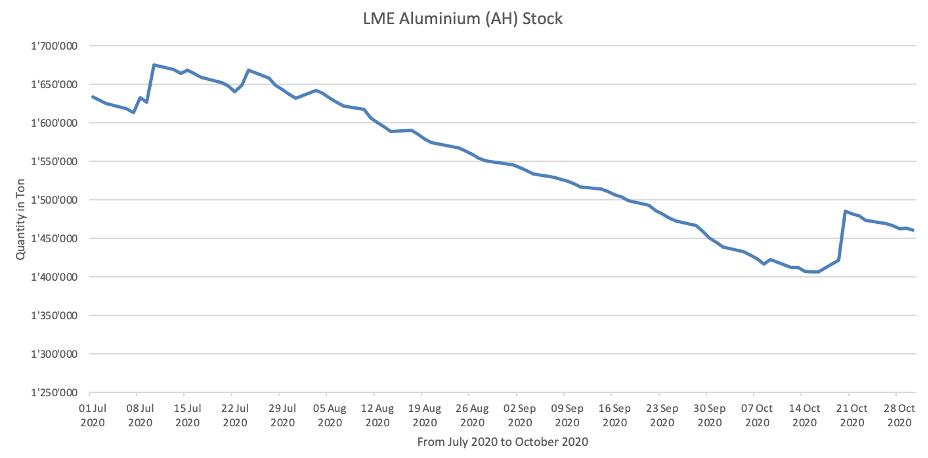
When it comes to the world ending inventory of soybeans, they unsurprisingly declined over the past three years as shown below:
Source: CME Group
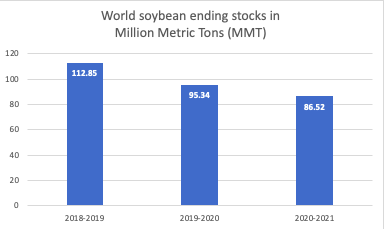
Even though much of it can be attributed to Brazil, the ending stocks of US soybeans have significantly dropped as well (-333 million of Bushels, which represent a decrease of 64% from year 19/20 to year 20/21) which is explained by a reduced production in most of the producing states, and an increasing demand mainly from China, but also from Brazil, which has been forced to import US soybeans since their local production was altered due to reduced rainfalls. In fact, the situation is such that 20/21 could record the lowest ending stocks of soybeans since five years, according to the Agriculture and Horticulture Development Board.
SUBSTITUTES
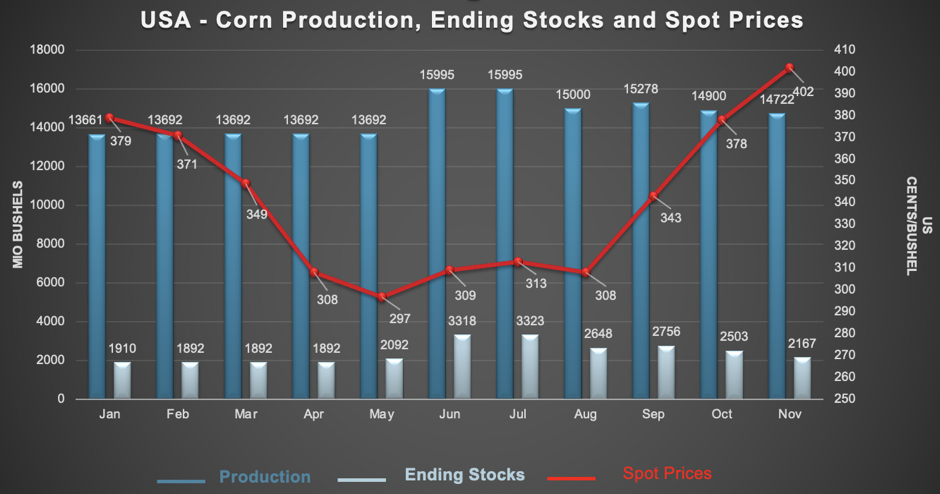
CORN
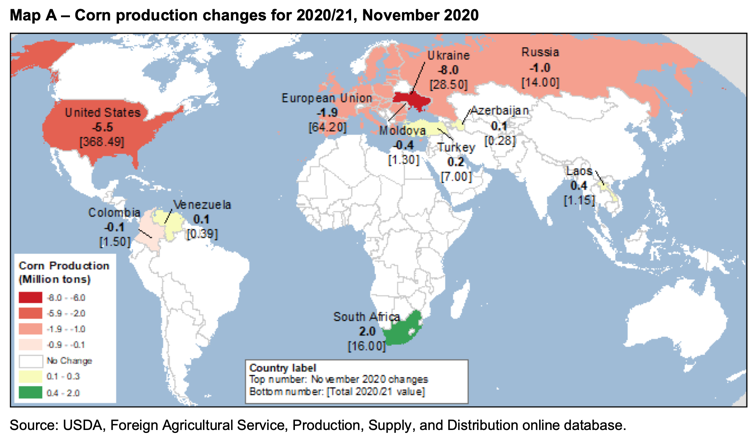
Corn is a substitute for soybean that China is using to feed livestock. This, coupled with the plunging Ukrainian production resulted in a 32% price increase between June 1st and November 30th
CRUDE PALM OIL
Soybean and palm oil are considered substitute goods because importers can easily switch between the two commodities. Most of the world’s palm oil production is located in Indonesia and Malaysia. There is a high volatility in the spread relationship between the two commodities because a drought in the United States could alter the soybean oil supply one year, while disease in Southeast Asia could alter the palm oil supply next year.
The two markets tend to move together. In fact, with the increase of soybean prices, this increases the price of crude palm oil as well.
In 2017, Malaysia exported 2.87 million tonnes of palm oil to China. However, the trade agreement between the US in China might in the long term affect the Malaysian exports of CPO. China might buy more soybean from the US than CPO from Malaysia.
RECOMMENDATION
As discussed, the production (supply) is uncertain for the following months due to weather issues in Latin America. Moreover, the demand is still high, showing an increase in the price. Since the production is uncertain coupled with COVID-19, the price will continue to increase and we can expect stocks at the beginning of the year to be lower compared to the previous years. We recommend going long over the next months as the supply will remain low.
With the US-China trade agreement, we can assume that the export (from the US) of soybean will drastically increase. However, this remains uncertain as China may “washout” imports from the United States.
REFERENCES
China Says Its Grain Imports Not to Blame for Global Price Surge – BNN Bloomberg, [no date]. [online]. [Viewed 2 December 2020]. Available from: https://www.bnnbloomberg.ca/china-says-its-grain-imports-not-to-blame-for-global-price-surge-1.1529331
Chinese buyers look to cancel U.S. soybean orders as processing margins shrink | Reuters, [no date]. [online]. [Viewed 2 December 2020]. Available from: https://www.reuters.com/article/us-china-soybeans-cancellations/chinese-buyers-look-to-cancel-u-s-soybean-orders-as-processing-margins-shrink-idUSKBN28510H
Corn Prices – 59 Year Historical Chart, [no date]. [online]. [Viewed 2 December 2020]. Available from: https://www.macrotrends.net/2532/corn-prices-historical-chart-data
Cover Story: ‘Predictability’ is the word to describe Biden’s trade war approach, 2020. The Edge Markets[online]. [Viewed 2 December 2020]. Available from: http://www.theedgemarkets.com/article/cover-story-predictability-word-describe-bidens-trade-war-approach
FEEDNAVIGATOR.COM, [no date]. Bullish picture for maize and soybeans. feednavigator.com [online]. [Viewed 2 December 2020]. Available from: https://www.feednavigator.com/Article/2020/11/12/Bullish-picture-for-maize-and-soybeans
Geosys How is La Niña impacting Brazilian and Argentina crops?, 2020. UrtheCast [online]. [Viewed 2 December 2020]. Available from: https://www.urthecast.com/how-is-la-nina-impacting-brazilian-and-argentina-crops/
snd_cbt.pdf, [no date]. [online]. [Viewed 2 December 2020]. Available from: https://www.cmegroup.com/trading/agricultural/files/ht_charts/snd_cbt.pdf
spreading-cbot-soybean-oil-and-bmd-crude-palm-oil.pdf, [no date]. [online]. [Viewed 2 December 2020]. Available from: https://www.cmegroup.com/trading/agricultural/files/spreading-cbot-soybean-oil-and-bmd-crude-palm-oil.pdf
wasde1120.pdf, [no date]. [online]. [Viewed 2 December 2020]. Available from: https://www.usda.gov/oce/commodity/wasde/wasde1120.pdf
Group 3 – K
Maxime DOLLA, Mahona PENNA, Romane POUCHON